Download
1 / 12
120 likes | 135 Views
The information and views in this report, our website & all the service we provide are believed to be relia-ble, but we do not accept any responsibility (or liability) for errors of fact or opinion. Users have the right to choose the product/s that suits them the most. Sincere efforts have been made to present the right investment perspective. The information contained herein is based on analysis and up on sources that we consider reliable. This material is for personal information and based upon it & takes no responsibility. The information given herein should be treated as only factor,

E N D
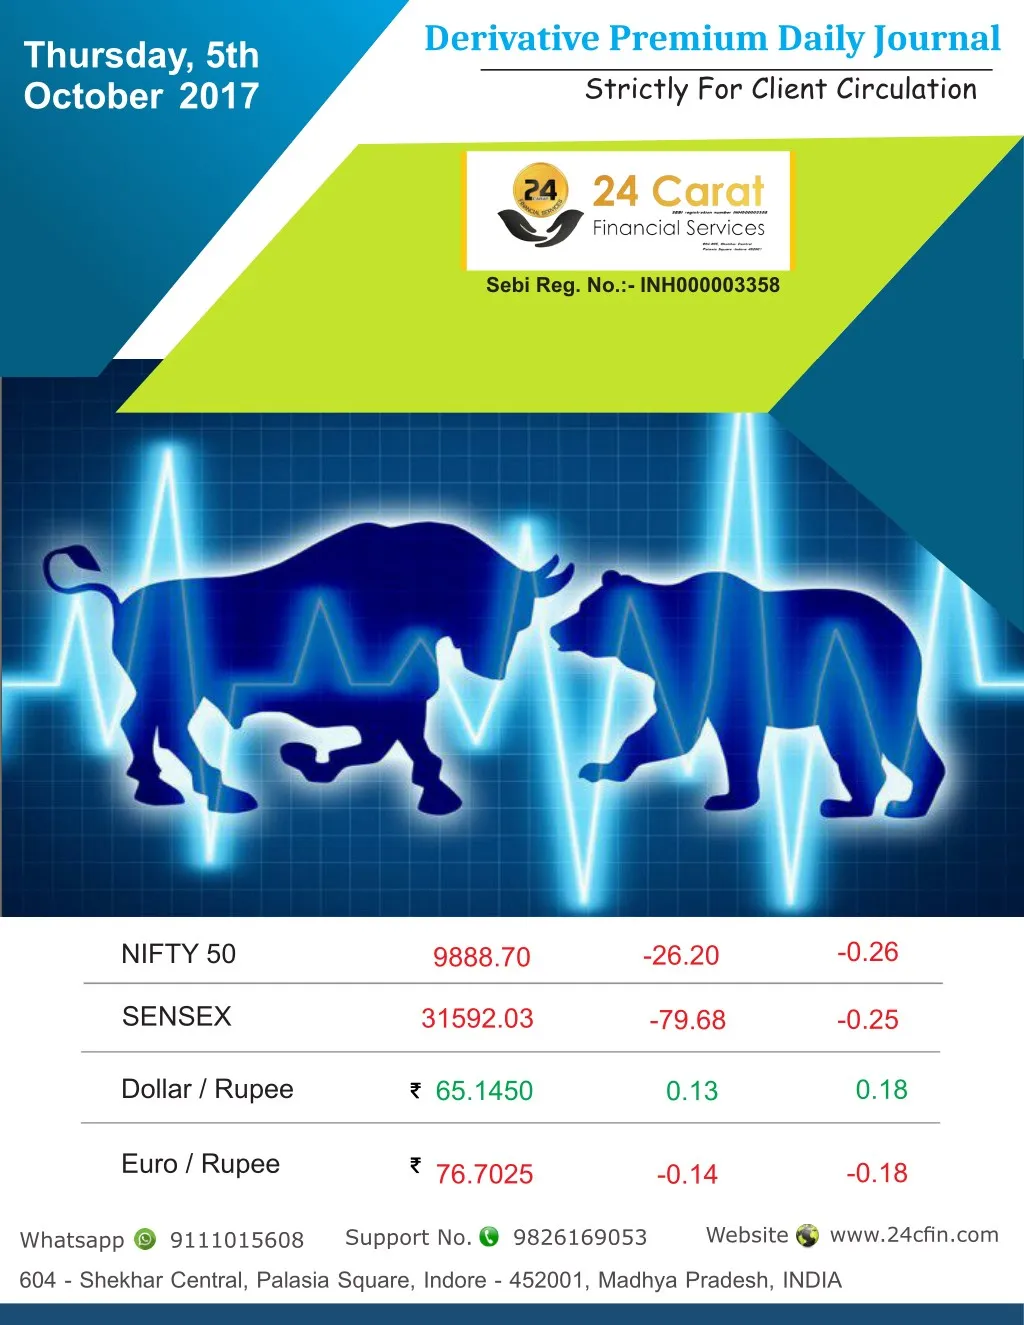
Derivative Premium Daily Journal Strictly For Client Circulation Thursday, 5th October 2017 Sebi Reg. No.:- INH000003358 -0.26 NIFTY 50 -26.20 9888.70 SENSEX 31592.03 -0.25 -79.68 Dollar / Rupee 0.18 65.1450 0.13 Euro / Rupee -0.18 76.7025 -0.14 Website www.24cfin.com Support No. 9826169053 Whatsapp 604 - Shekhar Central, Palasia Square, Indore - 452001, Madhya Pradesh, INDIA 9111015608
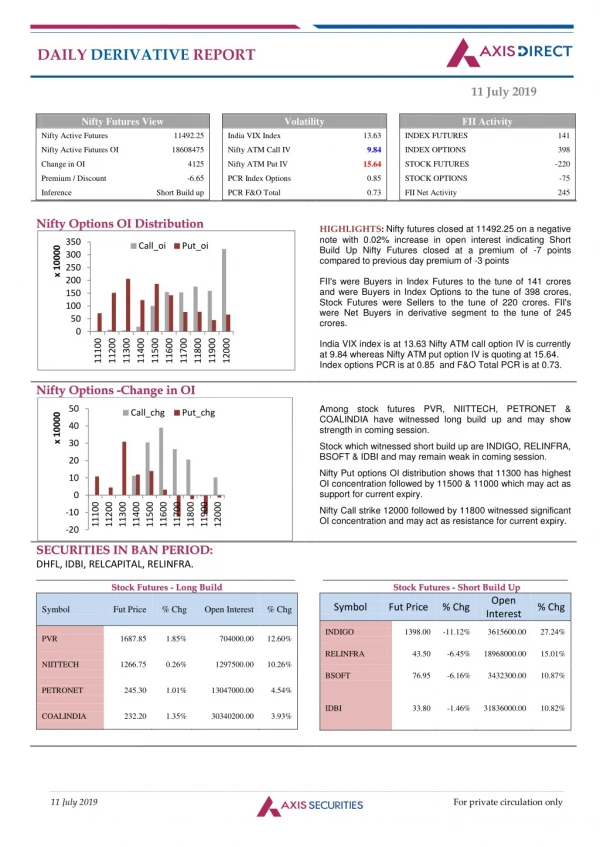
Derivatives Market Thursday, 5th October 2017 Nifty Bank Nifty 26-Oct-2017 26-Oct-2017 24,113.95 -31.45 -0.13% 9,915.00 -15.45 -0.16% Nifty Nifty 30-Nov-2017 28-Dec-2017 9,943.95 -11.25 -0.11% 9,975.05 -18.15 -0.18% Sector Indices Today % Change Index LTP High Low Nifty Realty Nifty Media Nifty Metal Nifty Pharma Nifty Energy Nifty PSU Bank Nifty Auto Nifty IT Nifty FMCG Nifty Financial Services 278.05 3,012.65 3,598.40 9,394.15 13,164.70 3,039.10 10,931.70 10,524.65 25,010.40 9,956.95 2.50 (0.91%) 18.00 (0.60%) 10.30 (0.29%) 21.85 (0.23%) 3.85 (0.03%) -1.35 (-0.04%) -11.00 (-0.10%) -15.20 (-0.14%) -95.05 (-0.38%) -43.60 (-0.44%) 280.20 3,023.35 3,616.00 9,508.65 13,223.85 3,055.70 11,019.20 10,581.30 25,247.10 10,016.80 276.30 2,988.15 3,584.35 9,377.35 13,108.00 3,011.55 10,920.10 10,514.25 24,965.40 9,945.95 Whatsapp Support No. Website 9111015608 9826169053 www.24cfin.com Sebi Reg. No.:- INH000003358
Thursday, 5th October 2017 Market Wrap Nifty, Sensex end in negative territory Major benchmark indices, Ni?y and Sensex closed lower by 26 points or 0.26% at 9,888 level and 79 points or 0.25% at 31,592 level. There were 933 advances, 706 declines and 325 unchanged stocks on NSE indica?ng posi?ve breadth floa?ng in the market. India VIX ended lower by 1.52% at 11.62 level. In the broader markets, BSE Mid-cap index closed at 15,691 level, up by 77 points, while BSE Small-cap index closed at 16,449 level, up by 128 points. Bank Ni?y ended at 24,058 level, down by 55 points or 0.23%. Selling ac?vity was seen in sectors including IT, FMCG, Telecom and Auto, while all the other sectoral indices on BSE closed in the posi?ve territory. Ni?y Media index was the top gaining index ending at 3012 level, up by 0.60%. Ni?y Financial Services index ended lower by 0.44% at 9956 level. Punjab Na?onal Bank was the top gainer in the Bank Ni?y index atRs 132.70 per share up 2.12%. IDFC Bank and IDFC Bank were also among the top gainers on the index ending higher by 1%. Buzzing Stocks ü Closing Bell:Gainers: Aurobindo (+2.5%), Ambuja, NTPC (+2%). Losers: Tech Mahindra, Infratel (-3%). üSBI puts 24 accounts with outstanding loan of Rs 3554 Cr up for sale to ARCs/NBFCs/FIs/Banks, as per media reports. üNi?y Realty Index up 1%. DLF, HDIL (+3%), Unitech, Pres?ge (+1.5%). üMaru? Suzuki Sept produc?on up 3.3% at 1.51 Lk units vs 1.46 Lk units (YoY). Stock ends marginally down. üGravita India stock jumps 13.5% on rise in lead price. üShoppers Stop stock shines 2.5% on acquisi?on of HyperCity by Future Retail. üNatco Pharma marke?ng partner Mylan launches generic Gla?ramer Acetate in the US market. Stock gains 3%. üGlenmark stock up 2% as UK regulator renews manufacturing licence at Baddi unit. Whatsapp Support No. Website 9111015608 9826169053 www.24cfin.com Sebi Reg. No.:- INH000003358
Thursday, 5th October 2017 FII DERIVATIVES STATISTICS As on 3rd October 2017 Buy OI(Open Interest) AT THE END OF THE DAY Sell Amt. in Crs No. of contracts Amt. in Crs Amt. in Crs No. of contracts No. of contracts 25463 476497 89085 49428 Index Futures Index Options Stock Futures Stock Options 2011.65 39148.2 6520.56 3728.57 14722 478557 73850 48917 1209.85 39336.0 5350.89 3679.57 253323 952809 841064 40762 19602.42 73382.31 58454.11 3042.14 FII/DII Activity 3/10/2017 Summary Derivative Segment: Index Futures: 801.8 Crs Index Options: -187.84 Crs Stock Futures: 1169.67 Crs Stock Options: 49.0 Crs Whatsapp Support No. Website 9111015608 9826169053 www.24cfin.com Sebi Reg. No.:- INH000003358
Nifty View Thursday, 5th October 2017 NIFTY 9888.70 -26.20 (-0.26%) Oct 5-Close Intraday 52 Week 10,178.95 9,927.00 9,945.95 OPEN HIGH P. CLOSE 9,914.90 9,881.85 7,893.80 LOWS 9960 R2 9920 R1 9905 Pivot S1 9865 S2 9840 ü In Thursday’s trading session Benchmark Indices Ni?y opened on a flat note and traded with sideways movement. Through the day, the Ni?y Index traded in a narrow range on the fla?sh side, apart from some posi?ve movements in the early part of the day. However, the market soon gave up its gains and con?nued to see sideways day of trade. Fresh selling in the last hour of trade dragged Indices lower and led to the market ending on a subdued note. Ni?y Index snapped its four-day gaining streak to close below 9900-mark. Ni?y closed lower by 26 points or 0.26% at 9,888 level. ü Technically Ni?y index is trading below its trend line and its 21 days & 50 days moving averages, Ni?y Index also could not hold on it importa?on levels of 9900 on daily chart. ü Hence we are stay on our bearish move in ni?y & In next trading session down side movement can be seen in the index and it can test down side levels of 9840-9820. Ni?y index is facing strong resistance at 9960.Traders are advised to make short posi?ons in Ni?y around 9900-9990 for down side levels of 9850-9820 while 9960 would act as a strong resistance for stop loss. Whatsapp Support No. Website 9111015608 9826169053 www.24cfin.com Sebi Reg. No.:- INH000003358
Bank Nifty View Thursday, 5th October 2017 NIFTY BANK 24058.05 -55.25 (-0.23%) Oct 6 - Close Intraday 52 Week 25,198.80 24,114.75 24,188.30 OPEN HIGH P. CLOSE 24,113.30 24,033.35 17,606.90 LOWS 24250 R2 R1 24155 Pivot 24095 24000 S1 S2 24940 ü In Thursday’s trading session Bank Ni?y opened on a flat note and traded in a narrow range on the fla?sh side, apart from some posi?ve movements in the early part of the day. Bank Ni?y Index ended at 24,058 level, down by 55 points or 0.23%. Punjab Na?onal Bank was the top gainer in the Bank Ni?y index at Rs 132.70 per share up 2.12%. IDFC Bank were also among the top gainers on the index ending higher by 1%. ü Technically Bank Ni?y index is trading below its major resistance levels of 24250 and its 21 days & 50 days moving averages on daily chart. ü Hence we are stay on our bearish move in Bank Ni?y Index & in next trading session it can test down side levels of 23900-23800 if it breaches its major support levels of 24000 on lower side. Bank Ni?y Index is facing major resistance at 24250. Whatsapp Support No. Website 9111015608 9826169053 www.24cfin.com Sebi Reg. No.:- INH000003358
Thursday, 5th October 2017 Most Active-Nifty 50 Company Name Change Value LTP 251.60 -0.63% 339.07 St Bk of India 1.81% 198.13 171.10 NTPC -1.56% 298.31 271.80 ICICI Bank 1.03% 379.32 Yes Bank 359.45 -1.96% 200.05 Power Grid Corpn 204.95 Top Gainers/ Losers-Nifty 50 Top Gainers -Nifty 50 Company Name Top Losers-Nifty 50 Company Name Change Change LTP LTP 742.85 17.90 (2.47%) 450.95 -14.10 (-3.03%) Aurobindo Pharma Tech Mahindra 3.05 (1.81%) -11.85 (-2.85%) 171.10 404.65 NTPC Bharti Infra. 4.40 (1.63%) -4.10 (-1.96%) 273.95 204.95 Ambuja Cem. Power Grid Corpn 3.25 (1.20%) -8.50 (-1.91%) Coal India H P C L 273.25 435.65 3.65 (1.03%) -4.30 (-1.56%) Yes Bank ICICI Bank 359.45 271.80 Whatsapp Support No. Website 9111015608 9826169053 www.24cfin.com Sebi Reg. No.:- INH000003358
Thursday, 5th October 2017 Position Built Up Long Built Up Stock Future Volume LTP(Rs.) Contract Name MUTHOOTFIN - 26-Oct-2017 INDIANB - 26-Oct-2017 NTPC - 26-Oct-2017 IBULHSGFIN - 26-Oct-2017 SYNDIBANK - 26-Oct-2017 CHG(%) OI 478.8 268.95 171 1,261.9 64.7 0.70 0.49 1.73 0.08 1.65 2,215,500 3,714,000 27,032,000 6,536,800 18,117,000 717,000 1,028,000 7,700,000 2,384,800 6,615,000 Short Built Up Stock Future Volume 99,600 2,965,000 4,277,500 4,415,400 125,000 LTP(Rs.) Contract Name BALKRISIND - 26-Oct-2017 ADANIPORTS - 26-Oct-2017 M&MFIN - 26-Oct-2017 BEL - 26-Oct-2017 MCX - 26-Oct-2017 CHG(%) -0.35 -0.27 -0.81 -0.18 -0.89 OI 1,675 387.6 417.6 164.55 1,052.1 499,600 8,102,500 6,515,000 15,404,400 1,096,000 Long Unwinding Stock Future Volume 1,069,200 31,346,000 17,400 182,700 4,860,000 LTP(Rs.) Contract Name MINDTREE - 26-Oct-2017 RCOM - 26-Oct-2017 NESTLEIND - 26-Oct-2017 REPCOHOME - 26-Oct-2017 IBREALEST - 26-Oct-2017 CHG(%) OI 480.65 17.15 7,255.8 642.55 -0.37 -0.58 -1.46 -0.78\ -2.84 3,547,200 121,702,000 90,800 877,800 44,810,000 217 Short Covering Stock Future Volume 3,374,500 5,766,000 1,898,600 31,892,000 7,656,000 LTP(Rs.) Contract Name JSWENERGY - 26-Oct-2017 JSWSTEEL - 26-Oct-2017 ESCORTS - 26-Oct-2017 JPASSOCIAT - 26-Oct-2017 SAIL - 26-Oct-2017 CHG(%) OI 76.9 0.20 0.34 1.05 0.52 0.18 73,508,000 53,187,000 3,666,300 192,304,000 66,516,000 249.95 667.15 19.15 54.2 Whatsapp Support No. Website 9111015608 9826169053 www.24cfin.com Sebi Reg. No.:- INH000003358
Diamond Call Thursday, 5th October 2017 Range 1,238.00 - 1,284.00 52 week 666.65 - 1,334.50 Open 1,241.00 Vol. 728,561.00 Mkt cap 142.81B P/E 65.27 Century Textile and Industries Ltd (NSE:CENTURYTEX) 1,279.00 +41.95 (3.39%) Oct 5 - Close Currency in INR Century Textiles and Industries Limited is engaged in the business of textiles, rayon, cement, and pulp and paper. The Company's segments include Textiles, which includes yarn, cloth and denim cloth, viscose filament yarn and tire yarn; Pulp and Paper, which includes pulp, writing and printing paper, tissue paper and multilayer packaging board; Cement, which includes cement and clinker; Real Estate, which includes leased properties, and Others, which includes salt works, chemicals and floriculture. The Company operates through various divisions, such as Birla Century, Century Cement, Century Yarn, Maihar Cement, Century Manikgarh Cement, Cottons by Century, Century Pulp and Paper, and Century Rayon. The Company has approximately five cement plants and a grinding unit at various locations, with a total cement manufacturing capacity of over 12.8 million tons per annum. Its manufacturing units are located at Gujarat, Maharashtra, Uttarakhand and Madhya Pradesh. 1320 R2 1300 R1 1273 Pivot 1255 S1 1225 S2 Jus?fica?on & Comments ü CENTURYTEX is looking bullish on daily charts. Stock has crossed its major resistance level of 1270 and trading above it on daily chart. ü Stock is trading above its 21,50 & 100 days moving averages on daily chart. ü A?er a short correc?on stock has shown a good strength on higher levels and stock is managed to hold its important ü levels of 1200. In Thrusday's trading session a fresh breakout was seen in the stock. ü In next trading session up side movement can be seen in the stock and it can test up side levels of 1300 & 1320 if it ü crosses its next resistance levels of 1290 while down side 1250 will act as a good support levels. BUY CENTURYTEX OCT FUT @ 1273-1276 TARGET 1295/1310 STOP LOSS 1260 BUY CENTURYTEX 1300 OCT CALL OPTION @ 26-28 TARGET 36/46 STOP LOSS 20 Whatsapp Support No. Website 9111015608 9826169053 www.24cfin.com Sebi Reg. No.:- INH000003358
Diamond Call Thursday, 5th October 2017 Range 3,750.00 - 3,797.00 52 week 2,849.50 - 4,091.95 Open 3,796.00 Vol. 260,215.00 Mkt cap 748.99B P/E 35.62 Hero Motocorp Ltd (NSE:HEROMOTOCO) 3,750.65 -44.25 (-1.17%) Oct 5 - Close Currency in INR Hero MotoCorp Limited is a two-wheeler manufacturer. The Company manufactures and sells motorized two wheelers up to 350 cubic centimeters (cc) engine capacity, spare parts and related services. Its products include Karizma ZMR, Karizma, Xtreme Sports, Xtreme, Hunk, Impulse, Achiever, Ignitor, Glamour Programmed FI, Glamour, Super Splendor, Passion XPRO, iSmart 110, Passion PRO, Passion PRO TR, Splendor iSmart, Splendor PRO Classic, Splendor PRO, Splendor+, HF Deluxe ECO, HF Deluxe, HF Dawn, Duet, Maestro Edge, Maestro and Pleasure. It offers over 20 products comprising 100 cubic centimeters (CC), 110CC, 125CC, 150CC, 225CC and scooter category. Its manufacturing plants are located in Dharuhera, Haryana; Gurgaon, Haryana; Haridwar, Uttarakhand; Neemrana, Rajasthan, and Villa Rica, Colombia. Its research and development center is located in Jaipur, Rajasthan. It has a Global Parts Centre for manufacturing and supplying the parts at local and global markets at Neemrana, Rajasthan. 3820 R2 3790 R1 3770 Pivot 3740 S1 3720 S2 Jus?fica?on & Comments: ü HEROMOTOCO is looking bearish on daily charts. ü Stock has breached its major trend line down side and trading below it on daily chart. ü Stock has breached its major support levels of 3850 and trading below it on daily chart. Stock has formed H&S price pa?ern on higher levels and trading below it. ü Stock is tradibg below its 21 & 50 days moving averages on daily chart. ü In next trading session down side movement can be seen in the stock and it can test down side levels of 3700 & 3650 ü if it breaches its next support levels of 3750 while up side 3850 will act as a good resistance levels. SELL HEROMOTOCO OCT FUT @ 3780-3770 TARGET 3720/3670 STOP LOSS 3820 BUY HEROMOTOCO 3700 OCT PUT OPTION @ 40-45 TARGET 60/70 STOP LOSS 30 Whatsapp Support No. Website 9111015608 9826169053 www.24cfin.com Sebi Reg. No.:- INH000003358
Diamond Calls Performance Thursday, 5th October 2017 Our Previous Recommendation Call Date 3 Oct-2017 3 Oct-2017 3 Oct-2017 3 Oct-2017 4 Oct-2017 4 Oct-2017 4 Oct-2017 4 Oct-2017 Date P & L Target/SL +18,120/- NIL -10,000/- NIL +20,800/- +12,800/- +6,800/- NIL TG ACHIEVED CLOSED @ COST CLOSED @ COST CLOSED @ COST TG ACHIEVED TG ACHIEVED CLOSED @ 379.30 CLOSED @ COST BUY OIL OCT FUT @ 352-354 TARGET 358/364 STOP LOSS 348 BUY OIL 360 OCT CALL OPTION @ 7.70-8.50 TARGET 10/12 STOP LOSS 6 BUY BAJAJFINANCE OCT FUT @ 1876-1880 TARGET 1900/1920 STOP LOSS 1855 BUY BAJAJFINANCE 1900 OCT CALL OPTION @ 45-48 TARGET 60/70 STOP LOSS 35 BUY IBULHSGFIN OCT FUT @ 1252-1257 TARGET 1270/1290 STOP LOSS 1240 BUY IBULHSGFIN 1280 OCT CALL OPTION @ 24-26 TARGET 34/40 STOP LOSS 18 SELL BHARTIARTL OCT FUT @ 383-381 TARGET 376/370 STOP LOSS 387 BUY BHARTIARTL 370 OCT PUT OPTION @ 4.50-5.50 TARGET 7/10 STOP LOSS 3 Whatsapp Support No. Website 9111015608 9826169053 www.24cfin.com Sebi Reg. No.:- INH000003358
Bulls Eye’s Calls Monthly Performance Checked By:- Months Profit & Loss Rs. 4,53,400/- Rs. 58,520/- September 2017 October 2017 November 2017 December 2017 Disclaimer 24 CARAT FINANCIAL SERVICES The information and views in this report, our website & all the service we provide are believed to be relia-ble, but we do not accept any responsibility (or liability) for errors of fact or opinion. Users have the right to choose the product/s that suits them the most. Sincere efforts have been made to present the right investment perspective. The information contained herein is based on analysis and up on sources that we consider reliable. This material is for personal information and based upon it & takes no responsibility. The information given herein should be treated as only factor, while making investment decision. The re-port does not provide individually tailor-made investment advice. 24 Carat Financial services recommends that investors independently evaluate particular investments and strategies, and ncourages investors to seek the advice of a financial adviser. 24 Carat Financial Services shall not be responsible for any transaction conducted based on the information given in this report, which is in violation of rules and regulations of NSE and BSE. The share price projections shown are not necessarily indicative of future price performance. The information herein, together with all estimates and forecasts, can change without notice. Analyst or any person related to 24 Carat financial Services might be holding positions in the stocks recommended. It is under-stood that anyone who is browsing through the site has done so at his free will and does not read any views expressed as a recommendation for which either the site or its owners or anyone can be held responsible for. Any surfing and reading of the information is the acceptance of this disclaimer. All Rights Reserved. Investment in equity & bullion market has its own risks. We, however, do not vouch for the accuracy or the completeness thereof. we are not responsible for any loss incurred whatsoever for any financial profits or loss which may arise from the recommendations above 24 Carat Financial Services does not purport to be an invitation or an offer to buy or sell any financial instrument. Our Clients (Paid Or Unpaid), Any third party or anyone else have no rights to forward or share our calls or SMS or Report or Any Information Provided by us to/with anyone which is received directly or indirectly by them. If found so then Serious Legal Actions can be taken. Team : Designation Name Email (Technical Research Analyst-head) Mr. Prateek Gupta (Sr. Derivative & Technical Analyst) Mr. Lakhan Patidar (Commodity Research Analyst) Mr. Dharmendra Saloniya (Sr. Graphic Designer) Mr. Shubham Chinwar Whatsapp Support No. Website 9111015608 9826169053 www.24cfin.com Sebi Reg. No.:- INH000003358