Download
1 / 29
290 likes | 480 Views
What does the data tell us about Childhood Obesity?. Kath Roberts Dave Jenner EMPHO. Agenda Why is this a big issue? What data do we have and what does it tell us?. Why does obesity matter?. 1. because of adverse impacts on population health Overweight and obesity increase the risk of:

E N D
What does the data tell us about Childhood Obesity? Kath Roberts Dave Jenner EMPHO
Agenda • Why is this a big issue? • What data do we have and what does it tell us?
Why does obesity matter? 1. because of adverse impacts on population health • Overweight and obesity increase the risk of: • coronary heart disease • cancer • diabetes • high blood pressure • osteoarthritis • Obesity responsible for more than 9,000 premature deaths each year in England and reduces life expectancy on average by nine years
Why does obesity matter? 2. because of economic impact • Significant NHS opportunity costs • Significant impact on the wider economy
Why does obesity matter? 3. because prevalence is rising • Obesity levels in England have tripled in the past two decades; around a fifth (21%) of men and a quarter (24%) of women are now obese • Two thirds of men and approaching 60% of women are now either overweight or obese
Why does childhood obesity matter? 1. because of impacts on health and future health • being overweight in childhood increases risk of being overweight in adulthood • increased risk of early onset of preventable disease in adulthood, including diabetes, stroke and CVD. • starting to see children with maturity-onset (Type 2) diabetes • today’s children may have a shorter life expectancy than their parents. • negative stigma and bullying can contribute to low self esteem and depression
Why does childhood obesity matter? 2. because prevalence is rising • Between 1995 and 2004, the prevalence of obesity among children aged 2 to 10 rose from 9.9% to 14.3% • If we take no action, it is estimated that a third of girls and one fifth of boys will be obese by 2020.
Loud warnings Annual Report of the Chief Medical Officer 2002: “health time bomb” House of Commons Health Committee 2004 “... will soon surpass smoking as the greatest cause of premature loss of life” Royal College of Physicians et al, 2004 “the immediate challenge is to halt the upward trend in prevalence.”
Government Response • Joint DH/DfES/DCMS target “Halt the year-on-year rise in obesity among children under 11 by 2010 .... .... in the context of a broader strategy to tackle obesity in the population as a whole.” • Inclusion in planning guidance and performance management/reporting requirements of local organisations • ?Funding
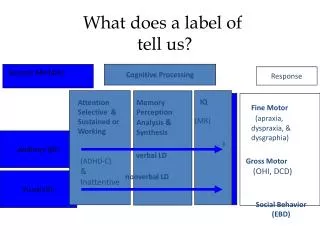
How is childhood obesity defined? 1. calculate BMI (kg/m2) 2. refer to National BMI percentiles (from Health Survey for England)
What data do we have on childhood obesity? • Until recently ... • Health Survey for England (around 4,000 children surveyed annually) • patchy HV and school nurse ht and wt data • some areas have self-report data from surveys • Summer 2006 ... • attempt at comprehensive R and Y6 data collection • awaiting analysis and reports
Variations: by GO region Prevalence of obesity in English children aged 2-10 Health Survey for England 1995-2003
Local Childhood ObesityMeasurement Programme • Annual requirement to measure Reception and Year 6 children in state primary schools • A shared programme - DfES and DH - started Summer 2006 • “to inform local planning and targeting of local resources and interventions and to enable tracking of local progress against PSA target”
Issues • no extra funding • labour intensive • school nurses diverted from other essential work • some schools didn’t support the programme • not all schools participated • not all children in schools participated and some parents refused consent • anecdotal evidence that it was the more overweight children who did not participate • lack of ethnicity data
Local Childhood ObesityMeasurement Programme • Currently awaiting reports from DH
Derbyshire DIY analysis ofSummer 2006 data • seven schools not included • 82% of Reception and 74% of Y6 children measured • 13,001 Reception and Year 6 children measured • WHO Classification of BMI • 74% normal range • 12% overweight • 9% obese or morbidly obese (higher % in Y6 than Reception) • 4% underweight • some indication of higher prevalence or obesity in more deprived LA
do we know why obesity prevalence is increasing? • do we have good measures of diet and physical activity and if so what do they tell us?
What do we know about childrens’ diets? • not a lot - much harder to measure • NDNS - comprehensive survey of 4-18 yr olds in 1997 - out of date • HSfE - data on 5-a-day • Expenditure and Food Survey has trends but relates to households • very little local data other than synthetic estimates
What do we know about childrens’ physical activity levels? • not much more • national patterns and trends from Health Survey for England, National Travel Survey • new local data from School Sport Survey • very little other consistent or comparable local data
AMBER VALLEY HEALTHRELATED ASSESSMENT PROGRAMMEYear 7 Children (January 2005)Leg Strength - Standing Broad (Long) JumpFlexibility - Sit and ReachLung Function - Peak Flow RateSpeed and Agility - 10 metre shuttle runBody Strength - Grip Strength & Back Strength Stamina - 60 Second RowQuestionnaire
We need ... • to get better at local child obesity measurement “what gets measured gets done” but equally or more importantly ... • a more extensive evidence base on “what works” in reducing obesity • i.e. more research ... and more local evaluation to inform practice