Download
1 / 29
290 likes | 387 Views
Results from Winter Storm Reconnaissance Program 2008. Yucheng Song IMSG / EMC/NCEP Zoltan Toth EMC/NCEP/NWS Sharan Majumdar Univ. of Miami Mark Shirley NCO/NCEP/NWS http://www.emc.ncep.noaa.gov/gmb/targobs. Acknowledgments. NWS field offices, HPC/NCEP and SDMs

E N D
Results from Winter Storm Reconnaissance Program 2008 Yucheng SongIMSG/EMC/NCEP Zoltan TothEMC/NCEP/NWS Sharan MajumdarUniv. of Miami Mark ShirleyNCO/NCEP/NWS http://www.emc.ncep.noaa.gov/gmb/targobs
Acknowledgments • NWS field offices, HPC/NCEP and SDMs • NOAA P-3 and the USAFR C-130 flight crews • CARCAH (John Pavone) • Jack Woollen - EMC • Russ Treadon - EMC • Mark Iredell - EMC • Istvan Szunyogh – Univ. of Maryland • Craig Bishop - NRL • + others who have contributed!
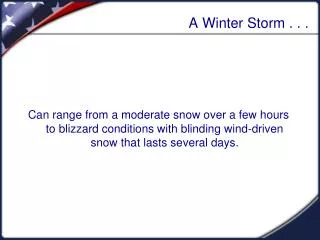
Winter Storm Reconnaissance Program Operational since January 2001 Objective: Improve Forecasts ofSignificant Winter Weather Events Through TargetedObservations in Data Sparse Northeast Pacific Ocean Adaptive approach to collection of observational data: 1) Only Prior to SignificantWinter Weather Events of Interest 2) Only in Areas that Influence high impact event Forecasts Past Results: 70+% of Targeted Numerical Weather Predictions Improve 10-20% error reduction for high impact event forecasts 12-hour gain in predicting high impact events – earlier warnings possible
Valentine’s day Storm • Weather event with a large societal impact • Each GFS run verified against its own analysis – 60 hr forecast • Impact on surface pressure verification • RMS error improvement: 19.7% • (2.48mb vs. 2.97mb) • Targeted in high impact weather area marked by the circle Surface pressure from analysis (hPa; solid contours) Forecast Improvement (hPa; shown in red) Forecast Degradation (hPa; blue)
Targeting methods – ETKF (application example) Dropsondes to be made by An Aircraft Storm The ETKF spotted the target area Expected error reduction propagation How NCEP WSR program works
About the Winter Storm Reconnaissance (WSR 2008) Program • Took place 17 Jan – 15 March 2008 • Dropwinsonde observations taken over the NE Pacific by aircraft operated by NOAA’s Aircraft Operations Center (P-3) and the US Air Force Reserve (C-130s). • Observations are adaptive – • collected only prior to significant winter weather events of interest • in areas that might influence forecast the most. • 35 good flights, around 629 dropsondes this winter due to the joint interests from HMT • G-IV was not available due to installation
WSR 2008 – New Tracks for P-3 • More ensemble members, efficient ET KF codes • No G-IV due to new instrument installation • New tracks for NOAA P-3 flying out of Portland, OR
Winter Storm Reconnaissance (WSR 2008) Program – Verification • Experiment Design - Global parallel NCEP GFS experiments • NCEP Global Forecast System running on T126L64 resolution hybrid-sigma with GSI vs. T12628 in the past • Three sets of experiments • A. GFS run with WSR dropsondes being assimilated • B. GFS run with WSR dropsondes data rejected on all days • Evaluation methods • Impact: compare differences between the paired runs • Forecast improvement: compare forecast fit to its own analysis • Fit to observations: spatially averaged over the verification regions
VERIFICATION • A Special HMT/WSR case • Verification statistics
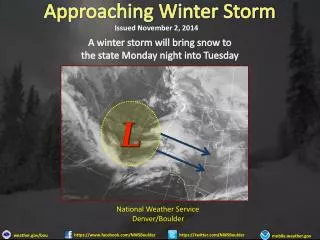
A special HMT mission Feb 24 00Z, 2008 Relative measure of predictability Large forecast uncertainties (blue regions) on Feb 22 and Feb 23, 2008
A special HMT/WSR mission (Atmospheric River, Feb 24, 00Z, 2008)
Impact of the Dropsondes Signal Propagation (250mb Height) Forecast improvement (Surface pressure)
Comparison of ETKF signal and NCEP signal(Remarkable resemblance) The ETKF signal The NCEPsignal
Comparison of ETKF signal and NCEP signal(Flight track 54, Feb 24 00Z 2008)
Forecast Verification for Surface pressure (2008) RMS error reduction vs. forecast lead time
Forecast Verification for Wind (2008) RMS error reduction vs. forecast lead time
Forecast Verification for Temperature (2008) RMS error reduction vs. forecast lead time
Overall results for Vector wind The RMS error reduction could reach as high as 30% in certain verification areas in 2007
Summary • Due to the lack of G-IV, 2008 is not an impressive year from verification results • P-3 tracks are close to inland (Portland, OR) - less likely the data would have a big impact • C-130 flying lower compared to G-IV • Upper level wind may be important, especially in the Jet regions – bode well for DWL measurement?
WSR Summary statistics (2004-2007) 25+22+19+26= 92 OVERALL POSITIVE CASES. 0+1+0+0 = 1 OVERALL NEUTRAL CASES. 10+7+8+11 = 36 OVERALL NEGATIVE CASES. 71.3% improved 27.9% degraded OVERALL EFFECT:
Composite summary maps 139.6W 59.8N 36hrs (7 cases) - 1422km 92W 38.6N 60hrs (5 cases)- 4064km 80W 38.6N 63.5hrs (8 cases) - 5143km 122W 37.5N 49.5hrs (8 cases) - 2034km Verification Region Verification Region
ETS 5mm 10mm 16.35 18.56 CTL 16.50 20.44 OPR Positive vs. negative cases 4:1 3:1 Precipitation verification • Precipitation verification is still in a testing stage due to the lack of station observation data in some regions.