Download
1 / 28
280 likes | 368 Views
MPI@LHC 2013. Tevatron Energy Scan: Findings & Surprises. Rick Field University of Florida. Outline of Talk. CDF data from the Tevatron Energy Scan. The overall event topology for events with at least 1 charged particle.

E N D
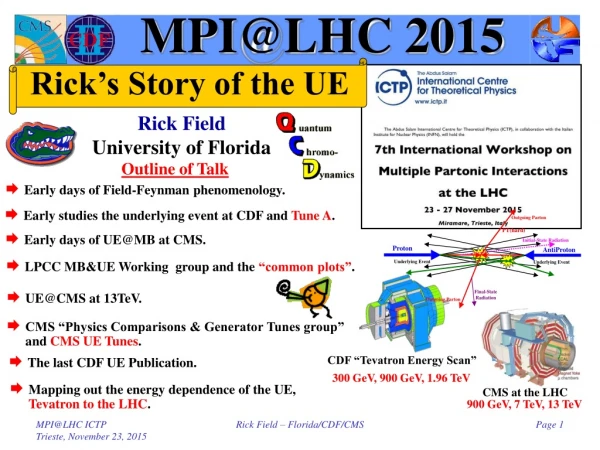
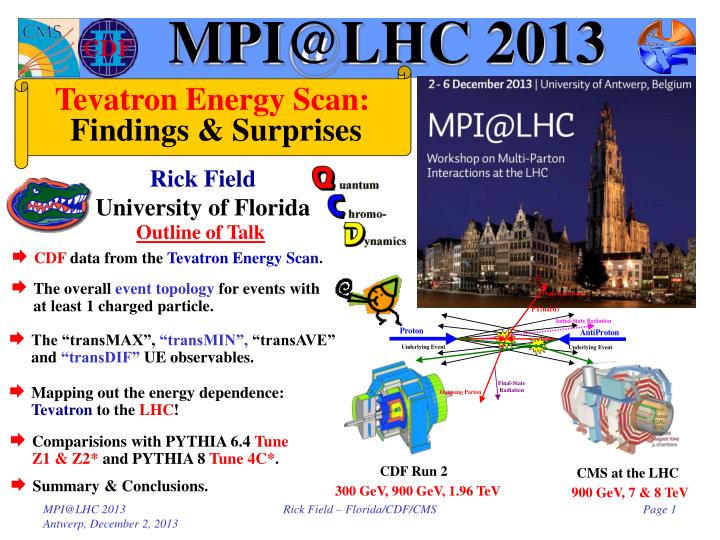
MPI@LHC 2013 Tevatron Energy Scan: Findings & Surprises Rick Field University of Florida Outline of Talk • CDF data from the Tevatron Energy Scan. • The overall event topology for events with at least 1 charged particle. • The “transMAX”, “transMIN”, “transAVE” and “transDIF” UE observables. • Mapping out the energy dependence: Tevatron to the LHC! • Comparisions with PYTHIA 6.4 Tune Z1 & Z2* and PYTHIA 8 Tune 4C*. CDF Run 2 CMS at the LHC • Summary & Conclusions. 300 GeV, 900 GeV, 1.96 TeV 900 GeV, 7 & 8 TeV Rick Field – Florida/CDF/CMS
Tevatron Energy Scan • Just before the shutdown of the Tevatron CDF has collected more than 10M “min-bias” events at several center-of-mass energies! 900 GeV 300 GeV 1.96 TeV 300 GeV 12.1M MB Events 900 GeV 54.3M MB Events Rick Field – Florida/CDF/CMS
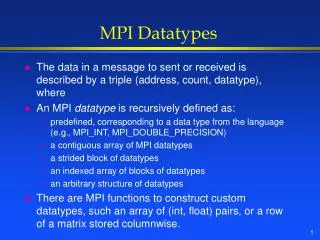
Jet Observables • “Toward” Charged Particle Density: Number of charged particles (pT > 0.5 GeV/c, |h| < 0.8) in the “toward” region (not including PTmax) as defined by the leading charged particle, PTmax, divided by the area in h-f space, 2hcut×2p/3, averaged over all events with at least one particle with pT > 0.5 GeV/c, |h| < hcut. • “Toward” Charged PTsum Density: Scalar pT sum of the charged particles (pT > 0.5 GeV/c, |h| < 0.8) in the “toward” region (not including PTmax) as defined by the leading charged particle, PTmax, divided by the area in h-f space, 2hcut×2p/3, averaged over all events with at least one particle with pT > 0.5 GeV/c, |h| < hcut. • “Away” Charged Particle Density: Number of charged particles (pT > 0.5 GeV/c, |h| < 0.8) in the “away” region as defined by the leading charged particle, PTmax, divided by the area in h-f space, 2hcut×2p/3, averaged over all events with at least one particle with pT > 0.5 GeV/c, |h| < hcut. • “Away” Charged PTsum Density: Scalar pT sum of the charged particles (pT > 0.5 GeV/c, |h| < 0.8) in the “away” region as defined by the leading charged particle, PTmax, divided by the area in h-f space, 2hcut×2p/3, averaged over all events with at least one particle with pT > 0.5 GeV/c, |h| < hcut. hcut = 0.8 Rick Field – Florida/CDF/CMS
UE Observables • “Transverse” Charged Particle Density: Number of charged particles (pT > 0.5 GeV/c, |h| < hcut) in the “transverse” region as defined by the leading charged particle, PTmax, divided by the area in h-f space, 2hcut×2p/3, averaged over all events with at least one particle with pT > 0.5 GeV/c, |h| < hcut. • “Transverse” Charged PTsum Density: Scalar pT sum of the charged particles (pT > 0.5 GeV/c, |h| < hcut) in the “transverse” region as defined by the leading charged particle, PTmax, divided by the area in h-f space, 2hcut×2p/3, averaged over all events with at least one particle with pT > 0.5 GeV/c, |h| < hcut. • “Transverse” Charged Particle Average PT: Event-by-event <pT> = PTsum/Nchg for charged particles (pT > 0.5 GeV/c, |h| < hcut) in the “transverse” region as defined by the leading charged particle, PTmax, averaged over all events with at least one particle in the “transverse” region with pT > 0.5 GeV/c, |h| < hcut. • Zero “Transverse” Charged Particles: If there are no charged particles in the “transverse” region then Nchg and PTsum are zero and one includes these zeros in the average over all events with at least one particle with pT > 0.5 GeV/c, |h| < hcut. However, if there are no charged particles in the “transverse” region then the event is not used in constructing the “transverse” average pT. hcut = 0.8 Rick Field – Florida/CDF/CMS
Observables • Overall “Associated” Charged Particle Density: Number of charged particles (pT > 0.5 GeV/c, |h| < 0.8, not including PTmax) as defined by the leading charged particle, PTmax, divided by the area in h-f space, 2hcut×2p, averaged over all events with at least one particle with pT > 0.5 GeV/c, |h| < hcut. • Total Number of Charged Particles: Number of charged particles (pT > 0.5 GeV/c, |h| < 0.8, including PTmax) as defined by the leading charged particle, PTmax, with at least one particle with pT > 0.5 GeV/c, |h| < hcut. • Overall “Associated” Charged PTsum Density: Scalar pT sum of the charged particles (pT > 0.5 GeV/c, |h| < 0.8, not including PTmax) as defined by the leading charged particle, PTmax, divided by the area in h-f space, 2hcut×2p, averaged over all events with at least one particle with pT > 0.5 GeV/c, |h| < hcut. hcut = 0.8 Note: The overall “associated” density is equal to the average of the “Towards”, “Away”, and “Transverse” densities. Overall “Associated” Density = (“Towards” Density + “Away” Density + “Transverse” Density)/3 Rick Field – Florida/CDF/CMS
UE Observables • “transMAX” and “transMIN” Charged Particle Density: Number of charged particles (pT > 0.5 GeV/c, |h| < 0.8) in the the maximum (minimum) of the two “transverse” regions as defined by the leading charged particle, PTmax, divided by the area in h-f space, 2hcut×2p/6, averaged over all events with at least one particle with pT > 0.5 GeV/c, |h| < hcut. • “transMAX” and “transMIN” Charged PTsum Density: Scalar pT sum of charged particles (pT > 0.5 GeV/c, |h| < 0.8) in the the maximum (minimum) of the two “transverse” regions as defined by the leading charged particle, PTmax, divided by the area in h-f space, 2hcut×2p/6, averaged over all events with at least one particle with pT > 0.5 GeV/c, |h| < hcut. hcut = 0.8 Overall “Transverse” = “transMAX” + “transMIN” Note: The overall “transverse” density is equal to the average of the “transMAX” and “TransMIN” densities. The “TransDIF” Density is the “transMAX” Density minus the “transMIN” Density “Transverse” Density = “transAVE” Density = (“transMAX” Density + “transMIN” Density)/2 “TransDIF” Density = “transMAX” Density - “transMIN” Density Rick Field – Florida/CDF/CMS
“transMIN” & “transDIF” • The “toward” region contains the leading “jet”, while the “away” region, on the average, contains the “away-side” “jet”. The “transverse” region is perpendicular to the plane of the hard 2-to-2 scattering and is very sensitive to the “underlying event”. For events with large initial or final-state radiation the “transMAX” region defined contains the third jet while both the “transMAX” and “transMIN” regions receive contributions from the MPI and beam-beam remnants. Thus, the “transMIN” region is very sensitive to the multiple parton interactions (MPI) and beam-beam remnants (BBR), while the “transMAX” minus the “transMIN” (i.e. “transDIF”) is very sensitive to initial-state radiation (ISR) and final-state radiation (FSR). “TransMIN” density more sensitive to MPI & BBR. “TransDIF” density more sensitive to ISR & FSR. 0 ≤ “TransDIF” ≤ 2×”TransAVE” “TransDIF” = “TransAVE” if “TransMIX” = 3×”TransMIN” Rick Field – Florida/CDF/CMS
PTmax UE Data • CDF PTmax UE Analysis: “Towards”, “Away”, “transMAX”, “transMIN”, “transAVE”, and “transDIF” charged particle and PTsum densities (pT > 0.5 GeV/c, |h| < 0.8) in proton-antiproton collisions at 300 GeV, 900 GeV, and 1.96 TeV (R. Field analysis). • CMS PTmax UE Analysis: “Towards”, “Away”, “transMAX”, “transMIN”, “transAVE”, and “transDIF” charged particle and PTsum densities (pT > 0.5 GeV/c, |h| < 0.8) in proton-proton collisions at 900 GeV and 7 TeV (Mohammed Zakaria Ph.D. Thesis, CMS PAS FSQ-12-020). • CMS UE Tunes: PYTHIA 6.4 Tune Z1 (CTEQ5L) and PYTHIA 6.4 Tune Z2* (CTEQ6L) and PYTHIA 8 Tune 4C* (CTEQ6L). All 3 were tuned to the CMS leading chgjet “transAVE” UE data at 900 GeV and 7 TeV. See the next talk by Mohammed! Similar to Tune 4C by Corke and Sjöstrand! Rick Field – Florida/CDF/CMS
Tuning PYTHIA 6.2:Multiple Parton Interaction Parameters Remember the energy dependence of the “underlying event” activity depends on both the e = PARP(90) and the PDF! Hard Core Determines the energy dependence of the MPI! Determine by comparing with 630 GeV data! Affects the amount of initial-state radiation! Take E0 = 1.8 TeV Reference point at 1.8 TeV Rick Field – Florida/CDF/CMS
Total Number of Charged Particles <Nchg> = 4.8! • CDF and CMS data on the pseudo-rapidity distribution, dN/dh, for charged with pT > 0.5 GeV/c and |h| < 0.8 for events with at least one charged particle with pT > 0.5 GeV/c and |h| < 0.8. • CDF and CMS data total number of charged particles with pT > 0.5 GeV/c and |h| < 0.8 for events with at least one charged particle with pT > 0.5 GeV/c and |h| < 0.8 plotted versus the center-of-mass energy (log scale). The data are corrected to the particle level with errors that include both the statistical error and the systematic uncertainty. Rick Field – Florida/CDF/CMS
Total Number of Charged Particles Factor of 2.1 increase! • CDF and CMS data total number of charged particles with pT > 0.5 GeV/c and |h| < 0.8 for events with at least one charged particle with pT > 0.5 GeV/c and |h| < 0.8 plotted versus the center-of-mass energy (log scale). The data are corrected to the particle level with errors that include both the statistical error and the systematic uncertainty. • CDF and CMS data ratio of the total number of charged particles with pT > 0.5 GeV/c and |h| < 0.8 for events with at least one charged particle with pT > 0.5 GeV/c and |h| < 0.8 plotted versus the center-of-mass energy (log scale). The data are divided by the value at 300 GeV. The data are compared with PYTHIA 6.4 Tune Z1 Rick Field – Florida/CDF/CMS
Total Number of Charged Particles • CDF data at 1.96 TeV, 900 GeV, and 300 GeV on the total number of charged particles (including PTmax) as defined by the leading charged particle (PTmax) for charged particles with pT > 0.5 GeV/c and |h| < 0.8. The data are corrected to the particle level with errors that include both the statistical error and the systematic uncertainty. Rick Field – Florida/CDF/CMS
Total Number of Charged Particles • CMS and CDF data on the total number of charged particles (including PTmax) as defined by the leading charged particle (PTmax) for charged particles with pT > 0.5 GeV/c and |h| < 0.8. The data are corrected to the particle level with errors that include both the statistical error and the systematic uncertainty. Rick Field – Florida/CDF/CMS
“Associated” Charged Particle Density • Corrected CDF data at 1.96 TeV, 900 GeV, and 300 GeV on the “associated” charged particle density in the “toward”, “away”, and “transverse” regions as defined by the leading charged particle (PTmax) for charged particles with pT > 0.5 GeV/c and |h| < 0.8. The data are corrected to the particle level with errors that include both the statistical error and the systematic uncertainty. The data are compared with PYTHIA Tune Z1. Rick Field – Florida/CDF/CMS
“Transverse” Charge Particle Fraction • CMS and CDF dataon the fraction of charged particle in the “transverse” region as defined by the leading charged particle (PTmax) for charged particles with pT > 0.5 GeV/c and |h| < 0.8. The plot shows the “transverse” Nchg divided by the total Nchg.The data are corrected to the particle level with errors that include both the statistical error and the systematic uncertainty. Rick Field – Florida/CDF/CMS
“Associated” Charged Particle Density • Corrected CDF data at 1.96 TeV, 900 GeV, and 300 GeV on the “associated” charged particle density in the “toward”, “away”, and “transverse” regions as defined by the leading charged particle (PTmax) for charged particles with pT > 0.5 GeV/c and |h| < 0.8. The data are corrected to the particle level with errors that include both the statistical error and the systematic uncertainty. The data are compared with PYTHIA Tune Z1. Rick Field – Florida/CDF/CMS
“Associated” Charged PTsum Density • Corrected CDF data at 1.96 TeV, 900 GeV, and 300 GeV on the “associated” charged PTsum density in the “toward”, “away”, and “transverse” regions as defined by the leading charged particle (PTmax) for charged particles with pT > 0.5 GeV/c and |h| < 0.8. The data are corrected to the particle level with errors that include both the statistical error and the systematic uncertainty. The data are compared with PYTHIA Tune Z1. Rick Field – Florida/CDF/CMS
“transMAX/MIN” NchgDen • Corrected CDF data at 1.96 TeV, 900 GeV, and 300 GeV on the charged particle density in the “transMAX” and “transMIN” regions as defined by the leading charged particle (PTmax) for charged particles with pT > 0.5 GeV/c and |h| < 0.8. The data are corrected to the particle level with errors that include both the statistical error and the systematic uncertainty. The data are compared with PYTHIA 6.4 Tune Z1 and Tune Z2*. Rick Field – Florida/CDF/CMS
“tranMIN” Nchg Fraction • CMS andCDF data on the fraction of charged particles in the “transMIN” region as defined by the leading charged particle (PTmax) for charged particles with pT > 0.5 GeV/c and |h| < 0.8. The plot shows “transMIN” Nchg divided by the overall “transverse” Nchg.The data are corrected to the particle level with errors that include both the statistical error and the systematic uncertainty. Rick Field – Florida/CDF/CMS
“transMAX/MIN” NchgDen • Corrected CMS data at 7 TeV and CDF data at 1.96 TeV, 900 GeV, and 300 GeV on the charged particle density in the “transMAX” region as defined by the leading charged particle (PTmax) for charged particles with pT > 0.5 GeV/c and |h| < 0.8. The data are corrected to the particle level with errors that include both the statistical error and the systematic uncertainty. The data are compared with PYTHIA Tune Z1 and Tune Z2*. • Corrected CMS data at 7 TeV and CDF data at 1.96 TeV, 900 GeV, and 300 GeV on the charged particle density in the “transMIN” region as defined by the leading charged particle (PTmax) for charged particles with pT > 0.5 GeV/c and |h| < 0.8. The data are corrected to the particle level with errors that include both the statistical error and the systematic uncertainty. The data are compared with PYTHIA Tune Z1 and Tune Z2*. Rick Field – Florida/CDF/CMS
“transDIF/AVE” NchgDen • Corrected CMS data at 7 TeV and CDF data at 1.96 TeV, 900 GeV, and 300 GeV on the charged particle density in the “transDIF” region as defined by the leading charged particle (PTmax) for charged particles with pT > 0.5 GeV/c and |h| < 0.8. The data are corrected to the particle level with errors that include both the statistical error and the systematic uncertainty. The data are compared with PYTHIA Tune Z1 and Tune Z2*. • Corrected CMS data at 7 TeV and CDF data at 1.96 TeV, 900 GeV, and 300 GeV on the charged particle density in the “transAVE” region as defined by the leading charged particle (PTmax) for charged particles with pT > 0.5 GeV/c and |h| < 0.8. The data are corrected to the particle level with errors that include both the statistical error and the systematic uncertainty. The data are compared with PYTHIA Tune Z1 and Tune Z2*. Rick Field – Florida/CDF/CMS
“transMAX” NchgDen vs Ecm • Corrected CMS data at 7 TeV and CDF data at 1.96 TeV, 900 GeV, and 300 GeV on the charged particle density in the “transMAX” region as defined by the leading charged particle (PTmax) for charged particles with pT > 0.5 GeV/c and |h| < 0.8. The data are corrected to the particle level with errors that include both the statistical error and the systematic uncertainty. • Corrected CMS and CDF data on the charged particle density in the “transMAX” region as defined by the leading charged particle (PTmax) for charged particles with pT > 0.5 GeV/c and |h| < 0.8 with 5 < PTmax < 6 GeV/c. The data are plotted versus the center-of-mass energy (log scale). Rick Field – Florida/CDF/CMS
“Transverse” NchgDen vs Ecm <transMIN> = 4.7 <transMAX> = 2.7 • Corrected CMS data at 7 TeV and CDF data at 1.96 TeV, 900 GeV, and 300 GeV on the charged particle density in the “transMAX” and “transMIN” regions as defined by the leading charged particle (PTmax) for charged particles with pT > 0.5 GeV/c and |h| < 0.8 with 5 < PTmax < 6 GeV/c. The data are plotted versus the center-of-mass energy (log scale). • Ratio of CMS data at 7 TeV and CDF data at 1.96 TeV, 900 GeV, and 300 GeVto the value at 300 GeV for the charged particle density in the “transMAX” and “transMIN” regions as defined by the leading charged particle (PTmax) for charged particles with pT > 0.5 GeV/c and |h| < 0.8 with 5 < PTmax < 6 GeV/c. The data are plotted versus the center-of-mass energy (log scale). The data are compared with PYTHIA Tune Z1 and Tune Z2*. Rick Field – Florida/CDF/CMS
“Transverse” NchgDen vs Ecm <transAVE> = 3.1 <transDIF> = 2.2 • Corrected CMS data at 7 TeV and CDF data at 1.96 TeV, 900 GeV, and 300 GeV on the charged particle density in the “transAVE” and “transDIF” regions as defined by the leading charged particle (PTmax) for charged particles with pT > 0.5 GeV/c and |h| < 0.8 with 5 < PTmax < 6 GeV/c. The data are plotted versus the center-of-mass energy (log scale). • Ratio of CMS data at 7 TeV and CDF data at 1.96 TeV, 900 GeV, and 300 GeVto the value at 300 GeV for the charged particle density in the “transAVE” and “transDIF” regions as defined by the leading charged particle (PTmax) for charged particles with pT > 0.5 GeV/c and |h| < 0.8 with 5 < PTmax < 6 GeV/c. The data are plotted versus the center-of-mass energy (log scale). The data are compared with PYTHIA Tune Z1 and Tune Z2*. Rick Field – Florida/CDF/CMS
“TransMIN/DIF” vs Ecm The “transMIN” (MPI-BBR component) increases much faster with center-of-mass energy than the “transDIF” (ISR-FSR component)! Duh!! <transMIN> = 5.7 <transMIN> = 4.7 <transDIF> = 2.2 <transDIF> = 2.6 • Ratio of CMS data at 7 TeV and CDF data at 1.96 TeV, 900 GeV, and 300 GeVto the value at 300 GeV for the charged particle density in the “transMIN”, and “transDIF” regions as defined by the leading charged particle (PTmax) for charged particles with pT > 0.5 GeV/c and |h| < 0.8 with 5 < PTmax < 6 GeV/c. The data are plotted versus the center-of-mass energy (log scale). • Ratio of CMS data at 7 TeV and CDF data at 1.96 TeV, 900 GeV, and 300 GeVto the value at 300 GeV for the charged PTsum density in the “transMIN”, and “transDIF” regions as defined by the leading charged particle (PTmax) for charged particles with pT > 0.5 GeV/c and |h| < 0.8 with 5 < PTmax < 6 GeV/c. The data are plotted versus the center-of-mass energy (log scale). The data are compared with PYTHIA Tune Z1 and Tune Z2*. Rick Field – Florida/CDF/CMS
“Tevatron” to the LHC CMS CDF CDF CDF Tune Z2* & 4C* Rick Field – Florida/CDF/CMS
“Tevatron” to the LHC CMS CDF CDF CDF Tune Z2* & 4C* Rick Field – Florida/CDF/CMS
Summary & Conclusions What we are learning should allow for a deeper understanding of MPI which will result in more precise predictions at the future LHC energies of 13 & 14 TeV! • The “transverse” density increases faster with center-of-mass energy than the overall density (Nchg ≥ 1)! However, the “transverse” = “transAVE” region is not a true measure of the energy dependence of MPI since it receives large contributions from ISR and FSR. • The “transMIN” (MPI-BBR component) increases much faster with center-of-mass energy than the “transDIF” (ISR-FSR component)! Previously we only knew the energy dependence of “transAVE”. • PYTHIA 6.4 Tune Z1 & Z2* and PYTHIA 8 Tune 4C* do a fairly good job in describing the energy deperdence of the UE, however there is room for improvement! The parameterization PT0(Ecm) = PT0(Ecm/E0)e seems to work! We now have at lot of MB & UE data at 300 GeV, 900 GeV, 1.96 TeV, and 7 TeV! We can study the energy dependence more precisely than ever before! Rick Field – Florida/CDF/CMS