Download
1 / 1
10 likes | 141 Views
ACARICUARA. ACARICUARA. ACARICUARA. YAPU. YAPU. YAPU. LAND COVER. ANTHROP. m 2. FOREST. %. m 2. SAVANNA. %. ANTHROP. FOREST. SAVANNA. TOTAL AREA (ha). 1,334. 1,334. LAND-USE. 1,838.3. 12. 948.2. 6. # PATCH. # PATCH. 132. 321. 54. 289. 22. 135. 44. 55. FOREST.

E N D
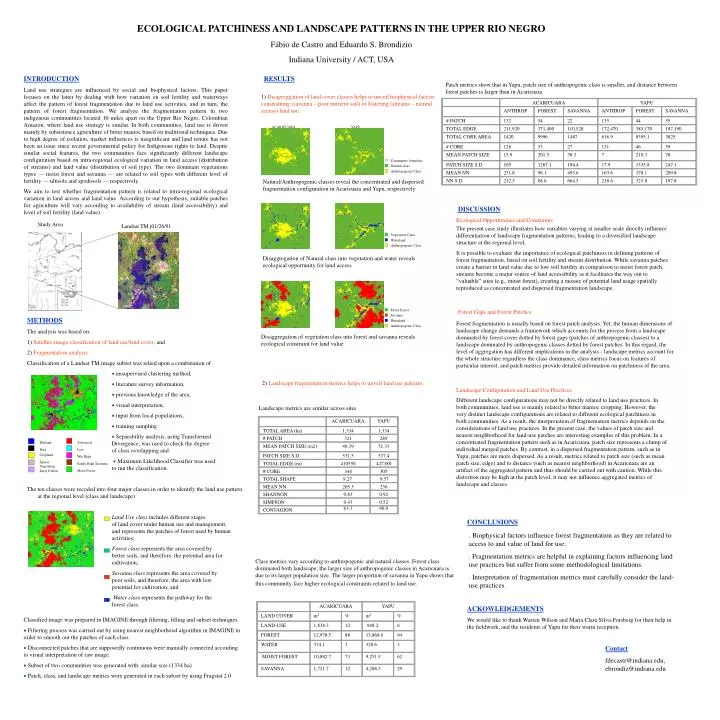
ACARICUARA ACARICUARA ACARICUARA YAPU YAPU YAPU LAND COVER ANTHROP m2 FOREST % m2 SAVANNA % ANTHROP FOREST SAVANNA TOTAL AREA (ha) 1,334 1,334 LAND-USE 1,838.3 12 948.2 6 # PATCH # PATCH 132 321 54 289 22 135 44 55 FOREST 12,978.5 88 13,868.6 94 MEAN PATCH SIZE (m2) TOTAL EDGE 211,920 46.19 371,400 51.31 110,520 172,470 385,170 197,190 WATER 374.1 3 328.6 3 TOTAL CORE AREA 1420 9996 1487 616.9 8395.1 3825 PATCH SIZE S.D. 531.5 537.4 MOIST FOREST 10,882.7 73 9,251.5 62 TOTAL EDGE (m) # CORE 126 410550 53 427380 27 131 46 59 ACARICUARA YAPU MEAN PATCH SIZE # CORE SAVANNA 1,721.7 13.9 344 12 201.5 305 4,288.5 78.3 29 7 210.3 78 TOTAL SHAPE 9.27 9.57 PATCH SIZE S.D. 105 1267.1 194.4 17.9 1335.8 247.1 Community boundary Natural class MEAN NN 265.5 236 MEAN NN 231.8 98.1 493.6 163.6 178.1 209.8 Anthropogenic Class SHANNON 0.83 0.92 NN S.D. 212.5 68.6 664.5 218.6 325.8 197.8 SIMPSON 0.43 63.3 0.52 60.0 Natural/Anthropogenic classes reveal the concentrated and dispersed fragmentation configuration in Acaricuara and Yapu, respectively CONTAGION Vegetation Class Waterland Anthropogenic Class Study Area Landsat TM j01/26/91 Disaggregation of Natural class into vegetation and water reveals ecological opportunity for land access Moist Forest Savanna Waterland Anthropogenic Class Disaggregation of vegetation class into forest and savanna reveals ecological constraint for land value Landscape metrics are similar across sites Wetland Advanced Fallow Bare soil Low Savanna Cropland Wet High Savanna Sparse Vegetation Sandy High Savanna Early Fallow Moist Forest ECOLOGICAL PATCHINESS AND LANDSCAPE PATTERNS IN THE UPPER RIO NEGRO Fábio de Castro and Eduardo S. Brondizio Indiana University / ACT, USA INTRODUCTION Land use strategies are influenced by social and biophysical factors. This paper focuses on the latter by dealing with how variation on soil fertility and waterways affect the pattern of forest fragmentation due to land use activities, and in turn, the pattern of forest fragmentation. We analyze the fragmentation pattern in two indigenous communities located 10 miles apart on the Upper Rio Negro, Colombian Amazon, where land use strategy is similar. In both communities, land use is driven mainly by subsistence agriculture of bitter manioc based on traditional techniques. Due to high degree of isolation, market influences is insignificant and land tenure has not been an issue since recent governmental policy for Indigenous rights to land. Despite similar social features, the two communities face significantly different landscape configuration based on intra-regional ecological variation in land access (distribution of streams) and land value (distribution of soil type). The two dominant vegetations types — moist forest and savanna — are related to soil types with different level of fertility — ultisols and spodosols — respectively. We aim to test whether fragmentation pattern is related to intra-regional ecological variation in land access and land value. According to our hypothesis, suitable patches for agriculture will vary according to availability of stream (land accessibility) and level of soil fertility (land value). RESULTS Patch metrics show that in Yapu, patch size of anthropogenic class is smaller, and distance between forest patches is larger than in Acaricuara. 1) Disagreggation of land cover classes helps to unveil biophysical factors constraining (savanna – poor nutrient soil) or fostering (streams – natural access) land use. DISCUSSION Ecological Opportunities and Constraints The present case study illustrates how variables varying at smaller scale directly influence differentiation of landscape fragmentation patterns, leading to a diversified landscape structure at the regional level. It is possible to evaluate the importance of ecological patchiness in defining patterns of forest fragmentation, based on soil fertility and stream distribution. While savanna patches create a barrier in land value due to low soil fertility in comparison to moist forest patch, streams become a major source of land accessibility as it facilitates the way out to “valuable” sites (e.g., moist forest), creating a mosaic of potential land usage spatially reproduced as concentrated and dispersed fragmentation landscape. Forest Gaps and Forest Patches METHODS The analysis was based on: 1) Satellite image classification of land use/land cover, and 2) Fragmentation analysis Classification of a Landsat TM image subset was relied upon a combination of unsupervised clustering method, literature survey information, previous knowledge of the area, visual interpretation, input from local populations, training sampling Separability analysis, using Transformed Divergence, was used to check the degree of class overlapping and Maximum Likelihood Classifier was used to run the classification. The ten classes were recoded into four major classes in order to identify the land use pattern at the regional level (class and landscape) Land Use class includes different stages of land cover under human use and management, and represents the patches of forest used by human activities; Forest class represents the area covered by better soils, and therefore, the potential area for cultivation; Savanna class represents the area covered by poor soils, and therefore, the area with low potential for cultivation; and Water class represents the pathway for the forest class. Forest fragmentation is usually based on forest patch analysis. Yet, the human dimensions of landscape change demands a framework which accounts for the process from a landscape dominated by forest cover dotted by forest gaps (patches of anthropogenic classes) to a landscape dominated by anthropogenic classes dotted by forest patches. In this regard, the level of aggregation has different implications in the analysis - landscape metrics account for the whole structure regardless the class dominance, class metrics focus on features of particular interest, and patch metrics provide detailed information on patchiness of the area. 2) Landscape fragmentation metrics helps to unveil land use patterns Landscape Configuration and Land Use Practices Different landscape configurations may not be directly related to land use practices. In both communities, land use is mainly related to bitter manioc cropping. However, the very distinct landscape configurations are related to different ecological patchiness in both communities. As a result, the interpretation of fragmentation metrics depends on the considerations of land use practices. In the present case, the values of patch size and nearest neighborhood for land-use patches are interesting examples of this problem. In a concentrated fragmentation pattern such as in Acaricuara, patch size represents a clump of individual merged patches. By contrast, in a dispersed fragmentation pattern, such as in Yapu, patches are more dispersed. As a result, metrics related to patch size (such as mean patch size, edge) and to distance (such as nearest neighborhood) in Acaricuara are an artifact of the aggregated pattern and thus should be carried out with caution. While this distortion may be high at the patch level, it may not influence aggregated metrics of landscape and classes. CONCLUSIONS . Biophysical factors influence forest fragmentation as they are related to access to and value of land for use. . Fragmentation metrics are helpful in explaining factors influencing land use practices but suffer from some methodological limitations. . Interpretation of fragmentation metrics must carefully consider the land-use practices. Class metrics vary according to anthropogenic and natural classes. Forest class dominated both landscape; the larger size of anthropogenic classes in Acaricuara is due to its larger population size. The larger proportion of savanna in Yapu shows that this community face higher ecological constraints related to land use. ACKOWLEDGEMENTS We would like to thank Warren Wilson and Maria Clara Silva-Forsberg for their help in the fieldwork, and the residents of Yapu for their warm reception. Classified image was prepared in IMAGINE through filtering, filling and subset techniques. Filtering process was carried out by using nearest neighborhood algorithm in IMAGINE in order to smooth out the patches of each class. Disconnected patches that are supposedly continuous were manually connected according to visual interpretation of raw image. Subset of two communities was generated with similar size (1334 ha) Patch, class, and landscape metrics were generated in each subset by using Fragstat 2.0 Contact fdecastr@indiana.edu, ebrondiz@indiana.edu