Download
1 / 76
770 likes | 917 Views
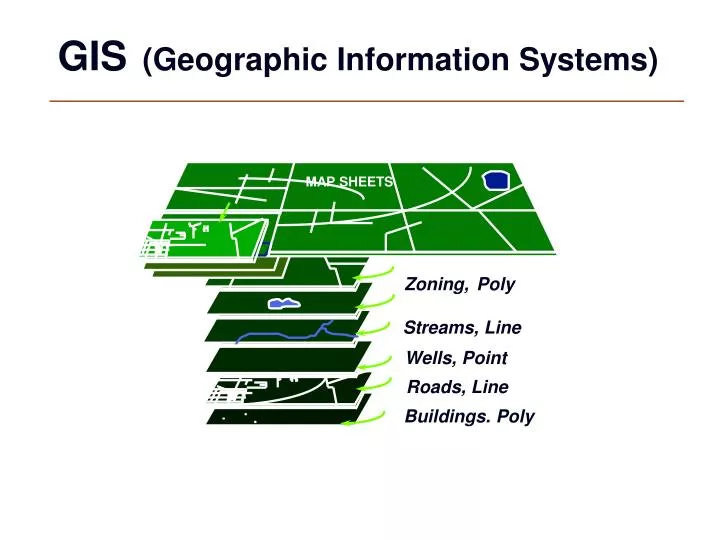
GIS (Geographic Information Systems). MAP SHEETS. Zoning, Poly. Streams, Line. Wells, Point. Roads, Line. Buildings. Poly. GIS Overview. What is GIS?.

E N D
GIS(Geographic Information Systems) MAP SHEETS Zoning, Poly Streams, Line Wells, Point Roads, Line Buildings. Poly
What is GIS? GIS (Geographic Information System): computer information system that can input, store, manipulate, analyze, and display geographically referenced (spatial) data to support decision making processes.
Tools for a GIS • Hardware • Computer • Printer / Plotter • Digitizer • Scanner • GIS Desktop Software (ESRI, Inc. – ArcView) • CAD Software (AutoDesk - AutoCAD) • Multimedia (Photos, Video, 3D Models) • World Wide Web (ESRI, Inc. – ARCIMS) • Personnel
GIS Data Sources • Digitized and Scanned Maps • purchased, donated, free (Internet) • created by user • Data Bases– Tables of data • GPS– Global Positioning System • accurate locations • Field Sampling of Attributes • Remote Sensing & Aerial Photography
Conventional Information Systems • Answer the following questions: • Who ? • What ? • When ? • Why ? • How ?
GIS answers the following • Location:What is at...? • Condition:Where is it? • Trends:What has changed since...? • Patterns:What spatial patterns exist? • Modeling:What if…? Exploring data using GIS turns data into information into knowledge
Data Data Data • Location DataHow Many? – What Kind? – Where? • Scale of DataGlobal to Local • Data Presentation Words, Charts, Graphs, Tables, Maps, Photos
GIS Data • Raster Images - grids • “pixels” • satellite images • aerial photos • Vector - grids • features: points, lines & polygons • attributes: size, type, length, etc.
Databases • Not easy to interpret
Visualizing Data A picture is worth a thousand words
“Layers” of GIS Data Municipalities
“Layers” of GIS Data Census Tracts
“Layers” of GIS Data Lakes and Rivers
“Layers” of GIS Data Polluting Companies
“Layers” of GIS Data Schools
GIS Applications • Business Site Location, Delivery Systems, Marketing • GovernmentLocal, State, Federal, Military • Economic Development Population Studies, Incomes, Census and Demographic Studies • Emergency ServicesFire & Police • EnvironmentalMonitoring & Modeling • IndustryTransportation, Communication, Mining, Pipelines, Healthcare • Public HealthEpidemiology Studies • Urban PlanningLand Use, Historic studies, Environmental and Conservation Studies, Housing Studies, Crime Analysis • Politics Elections and Reappointment • EducationResearch, Teaching Tool, Administration Wherever Spatial Data Analysis is Needed
Percentage of Uninsured by Age Ages 19 - 64, 1999 Ages 0-18, 1999
Demographic Studies Brookings Institution Report – Back to Prosperity
Source: United States House of Representatives http://www.house.gov
Source: The Washington Post http://www.washingtonpost.com/wp-srv/elections/2004/pa/
Higher Education Locations Note the proliferation of schools located in SW Pennsylvania where the majority of Competitive Districts lie. Source: 50States.com http://www.50states.com/college/penn.htm http://www.50states.com/cc/penn.htm Pennsylvania Commission for Community Colleges http://www. .pacommunitycolleges.org/content/blogcategory/14/40/
School Location and Census Block Groups By District Competitiveness – 2006 Census Block Group centroids and 2-Mile buffers around each school. Using this method we can calculate how many people between 18-24 live within 2 miles of each school, and thus approximate how many persons 18-24 live in each Congressional District. Source: U.S. Census 2000
Competitive and Moderately Competitive Districtsfor 2006 Election Source: U.S. Census Washington Post
Allegheny County Housing Data Data obtained from U.S. Census
Children with Elevated Blood Levels Note: Cases aggregated to Census Tracts Data obtained from U.S. Census and Allegheny County Health Dept
Cases Zoomed to Neighborhoods Data obtained from U.S. Census and Allegheny County Health Dept
Cases Compared to Income Data obtained from U.S. Census and Allegheny County Health Dept
Cases by Educational Attainment Data obtained from U.S. Census and Allegheny County Health Dept