Download
1 / 22
220 likes | 313 Views
Data Science for VIVO. Dr. Brand Niemann Director and Senior Data Scientist Semantic Community http://semanticommunity.info http://www.meetup.com/Federal-Big-Data-Working-Group/ http://semanticommunity.info/Data_Science/Federal_Big_Data_Working_Group_Meetup February 25, 2014. Overview.

E N D
Data Science for VIVO Dr. Brand Niemann Director and Senior Data Scientist Semantic Community http://semanticommunity.info http://www.meetup.com/Federal-Big-Data-Working-Group/ http://semanticommunity.info/Data_Science/Federal_Big_Data_Working_Group_Meetup February 25, 2014
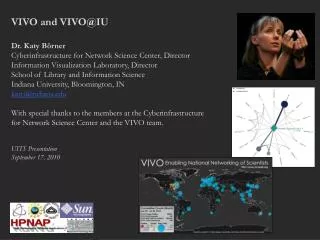
Overview • Data Fair Port Unconference 2014: • Discussed at Federal Big Data Working Group Meetup March 4th on Joint NSF-NIH Biomedical Big Data Research • Dr. Barend Mons referred to ORCID (Open Researcher and Contributor ID) VIVO in October 2012 Presentation • See Dr. Barend Mons 2010 VIVO Conference Video "The Next Step in Knowledge Evolution; Colonization of Brains..." • My Previous Work Was Data Science for VIVO!: • Build VIVO in the Cloud • Spotfire on Scholarly Databases • An Interface to a Digital Library of the Atlas of Science • 2010 Science and Engineering Indicators • Nobel Prizes • VIVOs Evolution from Semantic Web Application to DuraSpace: • VIVO is an open community, an information model, and an open source semantic web application. • VIVO is joining DuraSpace as the VIVO Project, to realize a shared mission through an established legal and financial framework compatible with VIVO’s own vision and goals. • DuraSpace is an independent 501(c)(3) not-for-profit born from a vision to help save our shared scholarly, scientific, and cultural record. • Indiana University Evolution from Information Visualization to Data Science: • This course provides an overview about the state of the art in information visualization. It teaches the process of producing effective visualizations that take the needs of users into account. • This year, the course can be taken for three Indiana University credits as part of the Online Data Science Program just announced by the School of Informatics and Computing. Students interested in applying to the program can find more information here. • Everyone who registers gains free access to the Scholarly Database (26 million paper, patent, and grant records) and the Sci2 Tool (100+ algorithms and tools). My Note: But not all of it!
Vivoweb.org http://www.vivoweb.org/
Indiana University CNS:Vivo Data and Visualizations http://wiki.cns.iu.edu/download/attachments/5898245/VIVO_2013_Workshop_Final.pptx
Indiana University CNS:VIVO Presentation Information http://wiki.cns.iu.edu/display/PRES/VIVO+Presentation+Information
Indiana University CNS:2.5 Sample Data Sets http://sci2.wiki.cns.iu.edu/display/SCI2TUTORIAL/2.5+Sample+Datasets
Cyberinfrastructure forNetwork Science Center http://cns.iu.edu/
Information Visualization MOOC http://ivmooc2014.appspot.com/home?
Pre-Questionnaire for the IVMOOC My Note: How did I do?
Emails for the IVMOOC • IVMOOC: Welcome to the Sci2 Tool • Thank you for registering for the Information Visualization MOOC. As part of this course, you will be using the Science of Science (Sci2) tool, an open source data mining and visualization software package developed by the team that runs the course. • We have created an account on the Sci2 website for you. Please use the link below to activate the account. • IVMOOC: SDB Account Confirmation • Thank you for registering for the Information Visualization MOOC. As part of this course, you will be asked to use data from the Scholarly Database, an open data source maintained by the team that runs the course. Our records show that your e-mail address is already registered for the Scholarly Database. Please take a moment to visit the below site and confirm that you remember your login information. • IVMOOC: Welcome to the Information Visualization MOOC: • Thank you for registering for the Information Visualization (IVMOOC) course. This email is to confirm receipt of your registration information. Unit one of the course will open on January 28, 2014, with another Unit opening each week. The course introduction posted on week one will include all the information about what you will need to do in order to earn the Mozilla Open Badge. • You should receive two emails in addition to this one that contain your login information for the Sci2 Tool and Scholarly Database, two free tools that you will be using throughout the course.
IVMOOC - Schedule http://ivmooc2014.appspot.com/course
IVMOOC - Week 5 • Many of you did a great job on the Mid-Term! All students who submitted the Mid-Term will receive a pointer to the correct answers shortly. For your information, the Mid-Term will be graded on a curve, see: • http://en.wikipedia.org/wiki/Grading_on_a_curve • Week 5 materials are now available at: • http://ivmooc.cns.iu.edu • Enjoy analyzing and visualizing trees.
Indiana University CNS:Vivo Data and Visualizations Overview
Published But Not the Raw Data http://www.plosone.org/article/info%3Adoi%2F10.1371%2Fjournal.pone.0039464
Indiana University CNS:Vivo Data and Visualizations Sample Data My Note: These are all very small compared to the UCSD Map of Science and Scholarly Database!
Temporal Visualization:Grants Over Time My Note: Not Impressed With This!
Statements I Disagree With! • Visualization brings large amounts of data together in a single graphic to allow for greater understanding. • All data is stored in the same format, via triples (subject, predicate, and object). • There is no table structure to guide data collection in a triple store. Instead, you have the ontology. The ontology defines how data is linked together, and is critical when it comes to retrieving that data. • With some understanding of the ontology, we’re ready to start writing SPARQL queries to get a data table for the visualization. • VIVO does not store information based on the name, as we would consider it. Instead, it assigns every entity a Uniform Resource Identifier (or URI). • Here is the core data behind this, see the problem? • http://vivo-netsci.cns.iu.edu/vivo12/display/Grant78086 • http://vivo-netsci.cns.iu.edu/vivo12/individual/Grant78086/Grant78086.rdf • Excel is generally the one that most people are familiar with, but it is rather limited in the ability to replicate work easily. • In the end, your final output can only be as good as the data that went into it.
Exercises and Data Sets • Burst Detection: • Use publication_result.csv • Normalizing publication title by using Lowercase, Tokenize, Stem, Stopword Text plugin. • Save as burst.csv • Map of Science: • Use publication_result.csv • The Journal Naming Convention plugin tries to normalize these names and link them to lookup tables within Sci2 to create the best matching possible. • Network: • Use publication_result.csv • Extract the Co-Author network using Extract Co-Occurrence Network plugin. • Visualize Using GUESS and Gephi. My Note: Use NodeXL
iNRN My Note: Still No Data! A centralized place for sharing and accessing networks, data, knowledge, and expertise. Further explores the evolution of VIVO. http://nrn.cns.iu.edu/#
Theory Unit Structure • Each theory unit comprises: • Examples of best visualizations • Visualization goals • Key terminology • General visualization types and their names • Workflow design • Read data • Analyze • Visualize • Discussion of specific algorithms http://ivmooc.cns.iu.edu/slides/01-schedule.pdf