Download
1 / 30
300 likes | 394 Views
CPDC/Commonwealth Foundation Caribbean Regional Civil Society Consultation. Presentation at the Consultation Panel on “CLIMATE CHANGE ENVIRONMENT” By Garfield Barnwell Director, Sustainable Development Caribbean Community (CARICOM) Secretariat Turkeyen, Greater Georgetown, GUYANA

E N D
CPDC/Commonwealth Foundation Caribbean Regional Civil Society Consultation Presentation at the Consultation Panel on “CLIMATE CHANGE ENVIRONMENT” By Garfield Barnwell Director, Sustainable Development Caribbean Community (CARICOM) Secretariat Turkeyen, Greater Georgetown, GUYANA Grand Coastal Hotel, Guyana 28 June, 2011
Structure of Presentation • Background Information • Climate Change in a Global Context • Implications of Climate Change Science • Responding to the global challenges: the basis for action • Observations and some key questions
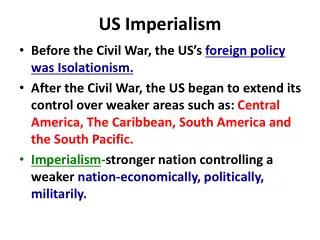
Background Information • Climate change has emerged as one of the greatest threats to sustainable development. • The scientific consensus is that increased concentrations of greenhouse gas emissions, resulting from human activities, have contributed to global temperature increases. • Predicted impacts, depending on the extent of temperature change, include sea level rises and more severe and frequent droughts and storms.
Figure I: The Greenhouse Effect Met Office Hadley Centre
Figure 2 :Strong Global Warming Observed Hadley Centre for Climate Prediction and Research Based on Folland et al (2000) and Jones and Moberg (2003)
Figure III : Rapid rise in the stock of Carbon Dioxide in the atmosphere post 1850 Source: IPCC TAR (slide taken from Hadley Centre)
Flows of emissions of CO2 from burning fossil-fuels have risen rapidly since 1950 Gt CO2 Source: World Resources Institute, CAIT
Global emissions of greenhouse gases come from a wide range of sources Agriculture 5.6 Gt 14% mostly from soils & livestock Energy – 25.6 Gt 61% Consuming fossil fuels Electricity & Heat Generation Land Use changes 7.6 Gt 18% primarily deforestation Transport Other energy Industry All GHG in CO2 equivalent Source: World Resources Institute. 2000 estimate.
Global emissions are forecast to grow from all sources transport & power generation growing fastest +2.1% 2002 actual emissions 2030 projected emissions annual average forecast % growth in emissions to 2030 +2.1% +1.2% +1.1% +0.7% Source: International Energy Agency, US Environmental Protection Agency, CO2 equivalent
Projected Changes in Global Average Temperature to 2100 under Different IPCC Emissions Scenarios (highest – A1FI, lowest – B1)
Warming will lead to major changes in water availability across the globe, with consequences for droughts and floods Change in the 2050s, based on IPCC Scenario A1 Source: Arnell (2004)
Temperature change by 2100 (relative to pre-industrial) Temperature change at equilibrium (relative to pre-industrial) Stabilisation Level (CO2 equivalent) Temperaturechange - based on IPCC 2001 climate models Temperature change - based on 2004 Hadley Centre ensembles Temperature change - based on IPCC 2001 climate models Temperature change - based on 2004 Hadley Centre ensembles 400ppm 1.2 - 2.5C 1.6 - 2.8C 0.8 - 2.4C 1.3 - 2.8C 450ppm 1.3 - 2.7C 1.8 - 3.0C 1.0 - 3.1C 1.7 - 3.7C 550ppm 1.5 - 3.2C 2.2 - 3.6C 1.5 - 4.4C 2.4 - 5.3C Increase in global temperature (relative to pre-industrial levels) for different stabilisation levels (expressed as CO2 equivalent). Source: Based on den Elzen and Meinhausen (2005).
Larger developing countries account for much of the forecast rise in emissions 145% 39% Projected emissions, 2025 2002 emissions 11% Energy Emissions only Gt CO2 95% 32% 78% 5% 63% 99% Source: World Resources Institute, CAIT Energy Information Administration Reference Scenario, Energy emissions only
Current emissions per capita are higher in developed countries 2002 CO2 Energy Emissions only Tonnes per person per year CO2 Source: World Resources Institute, CAIT
To stabilise at below 550 ppm, emissions must start to fall soon & developing countries must be part of the solution Business as usual (A2) Source IPPC
The Focus of the Regional Strategic Framework • Adaptation challenges over time depends on Mitigation progress; • Progress on Mitigation determines the approach to address the critical sectoral issues relating to Agriculture, Ecosystems, Water, Health, among others
The Regional Strategy • The strategy document is guided by two processes: (1)—the outcome of the BPOA and the MSI which is complemented by the UNFCCC decisions relating to Adaptation and the special circumstances of SIDS; (2) The institutional information and best practices developed from the implementation of a series of region projects
The CARICOM Adaptation Guidelines • The CARICOM Adaptation Programme is guided by the Intergovernmental Negotiating Committee’s recommended stages outlined below: • Stage I: Planning, which includes studies of possible impacts of climate change, to identify particularly vulnerable countries or regions and policy options for adaptation and appropriate capacity building; • Stage II: Measures, including further capacity-building, which may be taken to prepare for adaptation, as envisaged in Article 4.1(e) of the UNFCCC; and • Stage III: Measures to facilitate adequate adaptation, including insurance, and other adaptation measures as envisaged by Article 4.1(b) and Article 4.4 of the UNFCCC.
ADDRESSING CLIMATE CHANGE( A Caribbean Programme of Action) • Factors Considered : • Geographic location • Natural and Anthropogenic effects • Impact of Global Economics • Changes on the Caribbean • Desire for Economic sustainability in the region • The consequences of global warming and sea level rise in the Caribbean • The CARICOM Adaptation Programme
GEOGRAPHIC FACTORS • The Caribbean consists of 28 insular and coastal states and ten territories; • The World Bank in a May 2009 Report on Climate Change in the Hemispheric indicated that from a list of the 25 vulnerable countries to sea level rise 6 CARICOM (Suriname,Bahamas,Guyana,Belize,Jamaica,Haiti) are among the most vulnerable) • It is one of the largest salt water seas and has an area of about 2,754,000 km² (1,063,000 square miles). • It has an estimated population of 40 million people of which some 70% live in coastal cities, towns and villages • Approximately 38 percent of the population can be classified as poor.
NATURAL & ANTHROPOGENIC FACTORS • six months of hurricane activity • significant climate variability • several active volcanoes, both on land and under water • Significant seismic activity • Poor land marine practices • Damage to ecosystems use management coupled with poor
ECONOMIC FACTORS • Elements of economic globalization impacting the region’s environment through reduction of access to traditional markets as a result of the WTO agreement, since • Economic activities are frequently dominated by tourism and specialized agriculture such as sugarcane, and • Economic growth has failed to keep pace with population growth.
OBSERVED CHANGES IN CURRENT CLIMATE • The region is already experiencing changing weather patterns with more intense extremes including drought, floods and hurricanes. • Temperature records have shown an increase during the last century, with the 1990s being the warmest decade since the beginning of the 20th century. • Rainfall trends have been changing along with increased flooding in some areas and unusual droughts in other areas. • The tropical North Atlantic and Caribbean Sea warm pool has been expanding resulting in: • more frequent category 4 and 5 hurricanes resulting in mechanical damage to coral reefs and coastal erosion; • extensive coral bleaching and mortality.
ECONOMIC SUSTAINABILITY • Taken separately and collectively, these natural and anthropogenic factors are serious impediments to any effort at sustainable development and the attainment of the millennium development goals (MDG). • As an example, Grenada an island of population 90,000 is still recovering from hurricane Ivan of 2004. Damage from the hurricane has set back the country by decades. • The total damage was estimated at over US$1 billion compared to its GDP of US$440 million. • Hurricane damage in 2004 for the greater Caribbean was in excess of US$4 billion. • This yearly trend has continued through 2005, 2006, 2007 and 2008.
The consequences of global warming and sea level rise in the Caribbean • A warming climate and rising sea levels will pose significant, and in some cases insurmountable challenges to the region’s economic and social vulnerability. It will certainly have a negative impact on: • Agriculture and Fisheries, hence on its food security • Tourism, hence on its economic sustainability • Health, through increases in vector-borne diseases and other heat- related diseases • Water quality and quantity • Human Settlements, especially on the smaller islands.
The consequences of global warming and sea level rise in the Caribbean cont’d • A recent study has shown the potential economic costs as a percentage of GDP to Caribbean SIDS if no action is taken to reduce the impacts of climate change: • By 2025 the average cost to the region will be 14% of its GDP increasing to 39% by 2050, 45% by 2075 and 63% by 2100.
THE END MANY THANKS FOR LISTENING More Information: www.caricom.org www.caribbeanclimate.bz