Download

1 / 17
180 likes | 429 Views
Chapter 3 Study Guide. Today’s assignment: For 35 minutes, work independently and silently (without any notes) on the study guide. For the remaining 15 minutes, use your notes, quiz, and lab experience to check your work. Tomorrow:

E N D
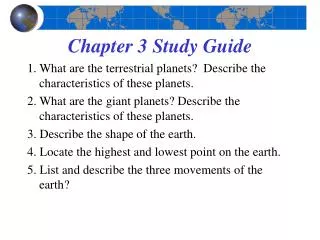
Chapter 3 Study Guide Today’s assignment: For 35 minutes, work independently and silently (without any notes) on the study guide. For the remaining 15 minutes, use your notes, quiz, and lab experience to check your work. Tomorrow: You will work as teams for the first 15 minutes to check your work, then I will review any questions you still have.
Vocabulary • A velocity-time graph shows how velocity is related to time. • The change in velocity of an object at an instant of time is its instantaneous acceleration. • The rate at which an object's velocity changes is its acceleration. • The motion of falling objects when air resistance is negligible is called free fall. • The average acceleration of an object is the change in velocity during some measurable time interval divided by that time interval. • The acceleration of an object in free fall that results from the influence of Earth's gravity is acceleration due to gravity.
Velocity-time graphs • Which has the greater acceleration, Object A or B? How do you know? Object B has the greater acceleration b/c it has a positive slope and Object A has a slope of zero. • Which of these objects has negative acceleration? How do you know? Object C is the only object with a negative slope. • Which of these objects started its motion from rest? Which object comes to a complete stop? Explain your answers. Only object B has an initial velocity of zero. Original question has been changed due to bad wording.
Velocity-time graphs • Object D crosses the axis while maintaining a constant positive acceleration. What does this indicate? Object D was initially moving backwards, slowed to a stop, then began moving forward. • Object A and Object E both have a constant velocity and acceleration of zero. What is different between these two? They are moving in opposite directions and Object A is moving faster than Object B.
graph 1 graph 2 graph 3 0 0 0 t t t graph 5 graph 6 graph 4 0 0 0 t t t v-t graphs vsd-t graphs 12. Which graph(s) show a car that is not moving?
graph 1 graph 2 graph 3 0 0 0 t t t graph 5 graph 6 graph 4 0 0 0 t t t v-t graphs vsd-t graphs 13. Which graph(s) show a car that is moving “backwards” or toward the origin?
graph 1 graph 2 graph 3 0 0 0 t t t graph 5 graph 6 graph 4 0 0 0 t t t v-t graphs vsd-t graphs 14. Which graph(s) show a car that is moving “forward” or away from the origin?
graph 1 graph 2 graph 3 0 0 0 t t t graph 5 graph 6 graph 4 0 0 0 t t t v-t graphs vsd-t graphs 15. Which graph(s) show a car that is speeding up?
graph 1 graph 2 graph 3 0 0 0 t t t graph 5 graph 6 graph 4 0 0 0 t t t v-t graphs vsd-t graphs 16. Which graph(s) show a car that is slowing down?
graph 1 graph 2 graph 3 0 0 0 t t t graph 5 graph 6 graph 4 0 0 0 t t t v-t graphs vsd-t graphs 17. Which graph(s) show a car that is moving at a constant speed?
graph 1 graph 2 graph 3 0 0 0 t t t graph 5 graph 6 graph 4 0 0 0 t t t v-t graphs vsd-t graphs 18. Which graph(s) show a car with positive velocity?
graph 1 graph 2 graph 3 0 0 0 t t t graph 5 graph 6 graph 4 0 0 0 t t t v-t graphs vsd-t graphs 19. Which graph(s) show a car with negative velocity?
graph 1 graph 2 graph 3 0 0 0 t t t graph 5 graph 6 graph 4 0 0 0 t t t v-t graphs vsd-t graphs 20. Which graph(s) show a car with positive acceleration?
graph 1 graph 2 graph 3 0 0 0 t t t graph 5 graph 6 graph 4 0 0 0 t t t v-t graphs vsd-t graphs 21. Which graph(s) show a car with negative acceleration?
graph 1 graph 2 graph 3 0 0 0 t t t graph 5 graph 6 graph 4 0 0 0 t t t v-t graphs vsd-t graphs 22. Which graph(s) show a car with no acceleration?
CPO Acceleration Lab Position Velocity Time Time • Draw the graph(s) for a car rolling down a hill (like in the lab). Neither graph should start at (0,0).
True/False • TRUE Freefall is the motion of a falling object when the air resistance is negligible. • TRUE Acceleration due to gravity is the same for objects of different sizes. • TRUE Acceleration due to gravity is always downward. • 29.4m/s If you drop a rock (freefall), its velocity after 3.00 s will be 19.6 m/s. • TRUE The decision to treat acceleration due to gravity as positive or negative depends on the coordinate system you use. • AT THE SAME TIME (Ignoring friction) A heavier object will fall to the ground faster than a lighter one. • 4X If it takes twice as long for a rock to hit the ground off of two different buildings, the taller building was about twice as tall as the shorter one. • TRUE On the moon, objects accelerate at about 1/6 of the value of gravity on Earth.