Download
1 / 1
10 likes | 112 Views
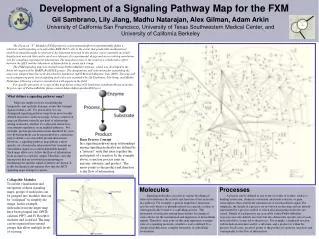
Early G1. Late G1. S. G2. M. G0. A Comprehensive Map of Molecular Interactions in RB Pathway Laurence Calzone (1) , Amélie Gelay (1) , Andrei Zinovyev (1) , François Radvanyi (2) , Emmanuel Barillot (1)

E N D
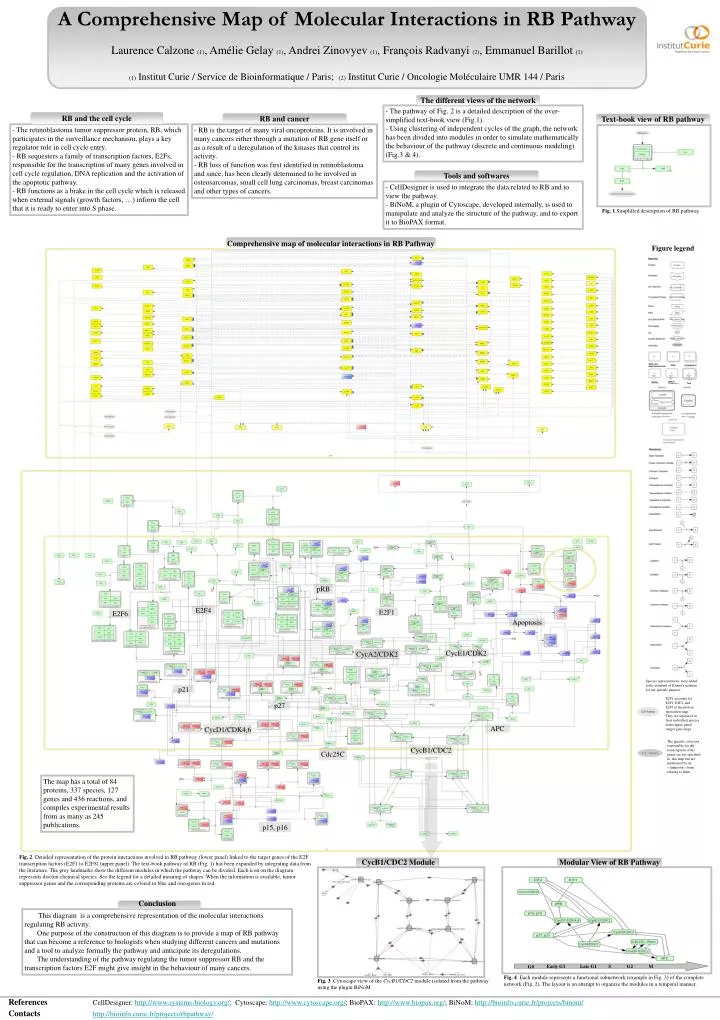
Early G1 Late G1 S G2 M G0 A Comprehensive Map of Molecular Interactions in RB Pathway Laurence Calzone (1), Amélie Gelay (1), Andrei Zinovyev (1), François Radvanyi (2), Emmanuel Barillot (1) (1)Institut Curie / Service de Bioinformatique / Paris; (2) Institut Curie / Oncologie Moléculaire UMR 144 / Paris The different views of the network - The pathway of Fig. 2 is a detailed description of the over-simplified text-book view (Fig.1).- Using clustering of independent cycles of the graph, the network has been divided into modules in order to simulate mathematically the behaviour of the pathway (discrete and continuous modeling) (Fig.3 & 4). RB and the cell cycle RB and cancer Text-book view of RB pathway • - The retinoblastoma tumor suppressor protein, RB, which participates in the surveillance mechanism, plays a key regulator role in cell cycle entry. • RB sequesters a family of transcription factors, E2Fs, responsible for the transcription of many genes involved in cell cycle regulation, DNA replication and the activation of the apoptotic pathway. • RB functions as a brake in the cell cycle which is released when external signals (growth factors, …) inform the cell that it is ready to enter into S phase. • - RB is the target of many viral oncoproteins. It is involved in many cancers either through a mutation of RB gene itself or as a result of a deregulation of the kinases that control its activity. • RB loss of function was first identified in retinoblastoma and since, has been clearly determined to be involved in osteosarcomas, small cell lung carcinomas, breast carcinomas and other types of cancers. Tools and softwares - CellDesigner is used to integrate the data related to RB and to view the pathway. - BiNoM, a plugin of Cytoscape, developed internally, is used to manipulate and analyze the structure of the pathway, and to export it to BioPAX format. Fig. 1.Simplified description of RB pathway Comprehensive map of molecular interactions in RB Pathway Figure legend pRB E2F4 E2F1 E2F6 Apoptosis CycA2/CDK2 CycE1/CDK2 Species representations were added to the standard of Kitano’s notation for our specific purpose: p21 E2F1 accounts for E2F1, E2F2, and E2F3 in the protein interaction map. They are separated in their individual species in the upper panel (target gene map). p27 APC CycD1/CDK4,6 The specific cofactors responsible for the transcription of the genes are not specified in this map but are mentioned by an « unknown » form relating to them. CycB1/CDC2 Cdc25C The map has a total of 84 proteins, 337 species, 127 genes and 436 reactions, and compiles experimental results from as many as 245 publications. p15, p16 Fig. 2. Detailed representation of the protein interactions involved in RB pathway (lower panel) linked to the target genes of the E2F transcription factors (E2F1 to E2F8) (upper panel). The text-book pathway of RB (Fig. 1) has been expanded by integrating data from the literature. The grey landmarks show the different modules in which the pathway can be divided. Each icon on the diagram represents disctint chemical species. See the legend for a detailed meaning of shapes. When the information is available, tumor suppressor genes and the corresponding proteins are colored in blue and oncogenes in red. CycB1/CDC2 Module Modular View of RB Pathway Conclusion This diagram is a comprehensive representation of the molecular interactions regulating RB activity. One purpose of the construction of this diagram is to provide a map of RB pathway that can become a reference to biologists when studying different cancers and mutations and a tool to analyze formally the pathway and anticipate its deregulations. The understanding of the pathway regulating the tumor suppressor RB and the transcription factors E2F might give insight in the behaviour of many cancers. Fig. 4. Each module represents a functional subnetwork (example in Fig. 3) of the complete network (Fig. 2). The layout is an attempt to organize the modules in a temporal manner. Fig. 3. Cytoscape view of the CycB1/CDC2 module isolated from the pathway using the plugin BiNoM References CellDesigner: http://www.systems-biology.org/; Cytoscape: http://www.cytoscape.org/; BioPAX: http://www.biopax.org/; BiNoM: http://bioinfo.curie.fr/projects/binom/ Contactshttp://bioinfo.curie.fr/projects/rbpathway/