Download
1 / 26
260 likes | 372 Views
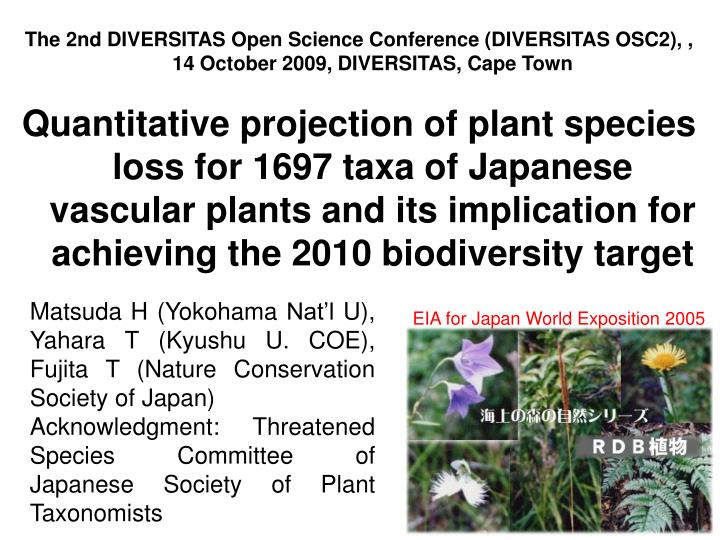
The 2nd DIVERSITAS Open Science Conference (DIVERSITAS OSC2), , 14 October 2009, DIVERSITAS, Cape Town Quantitative projection of plant species loss for 1697 taxa of Japanese vascular plants and its implication for achieving the 2010 biodiversity target.

E N D
The 2nd DIVERSITAS Open Science Conference (DIVERSITAS OSC2), , 14 October 2009, DIVERSITAS, Cape Town Quantitative projection of plant species loss for 1697 taxa of Japanese vascular plants and its implication for achieving the 2010 biodiversity target Matsuda H (Yokohama Nat’l U), Yahara T (Kyushu U. COE), Fujita T (Nature Conservation Society of Japan) Acknowledgment: Threatened Species Committee of Japanese Society of Plant Taxonomists EIA for Japan World Exposition 2005
Build Process of Red List Select ca. 2,100 species to investigate by the committee Investigate by >530 amateur investigators in ‘90s & ‘00s Calculate the extinct risk & Compile the tentative list Discuss by the committee &considering with all raw data Expert judgment by taxonomists Decide & publish the list of threatened species
Threatened plant database in Japan Database contents Candidate taxa: 1,972 taxa Field investigations in 1994-1995 and 2003-2004 Unit of investigation: 10×10km2 map grids Area: 3,781 map grids covered 84.8 % in Japan Participant: over 530 amateurs and botanists Records: 34,662 raw data No data 0 1 - 4 5 - 8 9 - 21 22 - 28 29 - 36 37 - 46 47 - 62 63 - 84 85 - 108 Recorded species per grid
Questionnaire items 父島 ヒメフトモモ フトモモ Syzygium cleyerifolium 父島 52,23,11 父島東平 2004.5.10 藤田卓 MAK 2004 5 10 藤田卓 ヤギの食害が著しい、 また、公園造成のために 2個体群が絶滅した 52, 23, 11 Species name Name of map grid 10~49 Population size Categorical data Decline rate during last decade Factors driving population declines Date & Name of investigators etc. 1/10~1/2
Database of each speciesex) Bupleurum scorzoneraefolium var. stenophyllum セリ科ミシマサイコ Transition during two surveys Distribution EOO*:present 5500km2 Population size: ca. 10,000 Decline rate: 35% per 10 years * EOO = Extent of Occurrence
Definition of decline rate using the same population in twice investigations
Extinction risk assumed by Monte Carlo simulation for each species Distribution of population size Randomly select following distribution of decline rate Present 100 101 102 103 Distribution of decline rates over the last 10 years Next 10 years 100 101 102 103 Next 20 yeas 100 101 102 103 Extinct
Projected individuals for 10000 independent iterations Population size Year after the present ex) Bupleurum scorzoneraefolium var. stenophyllum
The cumulative extinction risk &criterion E of Redlist Category of IUCN 28% after 100 years Vulnerable on Criteria E ex) Bupleurum scorzoneraefolium var. stenophyllum CR VU Cumulative extinction probability EN Year after the present
Criteria & Categories For example,,,,, Bupleurum scorzoneraefolium var. stenophyllum (VU) Habitat area EOO VU(B1) Euonymus boninensis (VU) We generally followed by IUCN’s Redlist Criteria ver.3.1 except for 1) Criterion B is not applied in Japan Endemic species in small islands are abundant. 2) Criteria priority E > A, C, D for species with adequate data (The criteria priority is not used by IUCN) Criterion E is essential risk assessment of AOO* *AOO = Area of occupation (grid of 1km2)
SBT Bellflower IUCN基準と環境省植物RDBIUCN criteria and Japanese plant RDB Reduction rate per decade Current Population size現存個体数
IUCN's credibility critically endangered. • Mrosovsky N (1997) Nature389:436 • IUCN’s recommendations are based on sound and open science. Recent events suggest that this is not always the case.
R. A. Myers & B. Worm (2003) Rapid worldwide depletion of predatory fish communities late RansomMyers Boris Worm …We conclude that declines of large predators that initially occurred in coastal regions, have extended throughout the global ocean, with potentially large consequences on ecosystems. Nature 423:280-283 (2003)
Rebuilding Global Fisheries (Worm et al. 2009) Current Exploitation Rate Current Biomass Trends of biomass (B) & exploitation rate (u) for 166 individual stocks. Current exploitation rate versus biomass for 166 individual stocks. Boris Worm
Improve Credibility & Datasets of Japanese Vascular Plant Redlist Number of species adopted each criteria in Japan. By expert judgment of plant taxonomists By Monte Carlo Simulation
Challenges for the future Necessary and Importance of cooperation of amateur investigators. training of investigators and botanists. Improving the simulation method to assess more accurately. (including generation time and …)
Crisis of Japanese vascular flora demonstrated by quantifying extinction risks for 1696 plant taxa Introduction Risk assessment → Estimating Future Extinction + Hotspot analysis → Setting priority for conservation
Transition during two surveys More populations and taxa decline than increase (sign test, p<0.001)
Past & Future Extinction in Japan 7000 6800 6600 6400 553 Extinct 7.9% Past Endemic species loss 6200 Future Non-endemic species loss 6000 2000 2020 2040 2080 2100 2060 CR(PE*) EX or EW Number of indigenous flora in Japan No of extinction Un known Year Year 8.6 species 55.3 species Extinction rates (per decade) 6.3-times larger *PE = Probably extinct (no report of extant grids)
Hotspots of future extinction in the next 100 years Extinction is observed over the country Remote Islands could be Hotspot of threat N27゜ E142゜ 0 - 1 1 - 5 6 - 10 11 - 15 16 - 20 21 - 25 26 - 30 31 - 35 36 - 40 How many reserves should be required for conservation of all threatened plants? Expectation of Extinction Next 100 years E135゜ N35゜
How to choose hotspotbased on the idea of Complimentarity Choose fewest number of hotspots that include all threatened species (Margules & Pressey 2000) Step 1: Count the number of threatened species in each grid Step 2: Choose a grid that include the largest number of threatened species as hotspot Step 3: Count the number of threatened species that do not exist in the hotspots Step 4: Iterate step 2 and 3 until the all threatened species are included. Grid Example • Choose grid 2 • Choose grid 4 • Grids 2 & 4 include all species A-D. species # spp.
How many reserves should be requiredfor conservation?-Complementarity analysis (Margules,C.R & Pressey,R.L., 2000)- ・ half of the taxa : 20 grids(0.4% in Japan) were required ・ All threatened taxa: 251 grids (5.4% in Japan) were required Maximizing the number of species conserved with the minimum land 100 600 500 400 Number of extinctions in next 100 years 251 (5.6%) 50 300 200 100 0 0 20 (0.4%) Japan includes 4457grids 0 50 100 150 200 250 300 Number of conserved grids
http://www.pref.kagoshima.jp/sangyo-rodo/rinsui/shinrin/syuryo/shuryokaikin.htmlhttp://www.pref.kagoshima.jp/sangyo-rodo/rinsui/shinrin/syuryo/shuryokaikin.html <5% <5% <5% <1% 0% <1% <10% <1% <70% <50% >70% <50% <50% <20% <50% >70% <10% <10% <10% <70% <20% <50% 0% 0% <10% 0% Shooting-ban area National Forest Strict W.P.A. Wildlife Protected Area World Natural Heritage Site Wilderness Area
How many reserves should be requiredfor conservation?-Complementarity analysis (Margules,C.R & Pressey,R.L., 2000)- ・ half of the taxa : 20 grids(0.4% in Japan) were required ・ All threatened taxa: 251 grids (5.4% in Japan) were required Maximizing the number of species conserved with the minimum land 100 600 500 400 Number of extinctions in next 100 years Ratio of Conservation Area % (National park etc..) 251 (5.6%) 50 300 200 100 0 0 20 (0.4%) Japan includes 4457grids 0 50 100 150 200 250 300 Number of conserved grids
Thank you for invitation! I like to try real time case studies with field ecologists! Plant Red Data Book Deer management Pelagic fish management EXPO2005 at Aichi, Revision of RDB Mainichi Shimbun FSNRI Bear management Shiretoko World Heritage H.M. at Shiretoko N. Ishii Mongoose eradication program at Amami Island 2004/1/29 26 2006/5/22 26 Windfirm birdstrikes