Download
1 / 14
140 likes | 214 Views
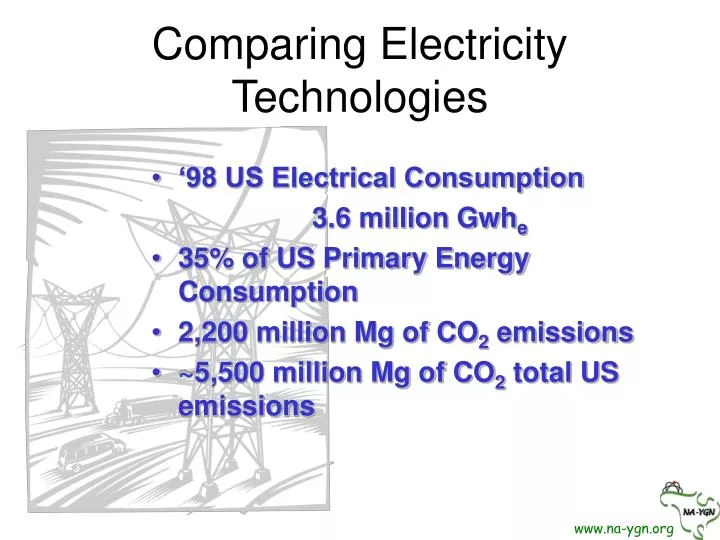
Comparing Electricity Technologies. ‘98 US Electrical Consumption 3.6 million Gwh e 35% of US Primary Energy Consumption 2,200 million Mg of CO 2 emissions ~5,500 million Mg of CO 2 total US emissions. 1998 Electricity Mix. 52%. Nuclear. <0.05%. 20%. Coal. Solar. Others: Hydro Oil

E N D
Comparing Electricity Technologies • ‘98 US Electrical Consumption 3.6 million Gwhe • 35% of US Primary Energy Consumption • 2,200 million Mg of CO2 emissions • ~5,500 million Mg of CO2 total US emissions www.na-ygn.org
1998 Electricity Mix 52% Nuclear <0.05% 20% Coal Solar Others: Hydro Oil Geothermal Biomass 14% <0.05% Natural Gas Wind www.na-ygn.org
Construction • Manufacturing of plant components, including: • mining materials (ie: iron) • processing materials (ie: steel) • construction of components (ie: solar cells) • energy for transportation • Site construction includes energy for: • heavy machinery www.na-ygn.org
Construction(tons of CO2 per GWhe) 1.3 14 1.9 13 1.3 www.na-ygn.org
Fuel Production • Exploration: • energy required to find fossil fuel or uranium resources • Mining, Processing & Refining • energy and equipment requires to mine resources and convert it to usable fuel • Transportation & Storage • energy required • possible leaks (ie: natural gas) www.na-ygn.org
Fuel Production(tons of CO2 per GWhe) 17.4 0 9.5 0 77 www.na-ygn.org
Fuel Consumption • Burning fossil fuels is the biggest direct contributor www.na-ygn.org
Fuel Consumption(tons of CO2 per GWhe) 956 0 0 0 376 www.na-ygn.org
Operation & Maintenance • Electrical power is needed to keep plant running reliably • Energy is needed to perform maintenance on the plant • Equipment may need to be replaced • this new equipment has all the same GHG emissions as the new equipment (ie. Construction) www.na-ygn.org
Operation & Maintenance(tons of CO2 per GWhe) 4 8 2.2 4.1 4 www.na-ygn.org
Decommissioning • Energy required to dismantle power plant • Energy required to destroy or dispose of used components • Energy required to reclaim land • heavy equipment for earth moving • reforestation • etc... www.na-ygn.org
Decommissioning(tons of CO2 per GWhe) 0.2 0.7 1.4 0.6 0.1 www.na-ygn.org
Total(tons of CO2 per GWhe) 980 23 15 18 460 www.na-ygn.org
Assumptions • Coal: • Based on 1000 MWe baseload coal station • Gas: • Based on 450 MWe baseload equivalent gas station • Nuclear: • Based on 1000 MWe baseload nuclear station • Solar: • Based on 100 MWe facility located in the Southwest US • GHG emissions for decommissioning are based on known values for wind and estimated for solar through a comparison of solar and wind construction costs • Wind: • Based on 25 MWe wind farm without storage • storage would increase emissions in construction and O&M (slightly in decomm.) www.na-ygn.org