Download
1 / 23
230 likes | 361 Views
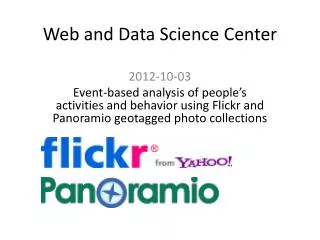
Web and Data Science Center. 2012-10-03 Event-based analysis of people’s activities and behavior using Flickr and Panoramio geotagged photo collections. Event-based analysis of people’s activities and behavior using Flickr and Panoramio geotagged photo collections.

E N D
Web and Data Science Center 2012-10-03 Event-based analysis of people’s activities and behavior using Flickr andPanoramiogeotagged photo collections
Event-based analysis of people’s activities and behavior using Flickr andPanoramiogeotagged photo collections http://bib.dbvis.de/uploadedFiles/264.pdf SlavaKisilevich, MilosKrstajic, Daniel Keim, Natalia Andrienko, Gennady Andrienko University of Konstanz, slaks@dbvis.inf.uni-konstanz.de Fraunhofer Institute IAIS, gennady.andrienko@iais.fraunhofer.de
Abstract Photo-sharing websites such as Flickr and Panoramio contain millions of geotagged images contributed by people from all over the world. Characteristics of these data pose new challenges in the domain of spatio-temporal analysis. In this paper, we define several different tasks related to analysis of attractive places, points of interest and comparison of behavioral patterns of different user communities on geotagged photo data. We perform analysis and comparison of temporal events, rankings of sightseeing places in a city, and study mobility of people using geotaggedphotos. We take a systematic approach to accomplish these tasks by applying scalable computational techniques, using statistical and data mining algorithms, combined with interactive geo-visualization. We provide exploratory visual analysis environment, which allows the analyst to detect spatial and temporal patterns and extract additional knowledge from large geotagged photo collections. We demonstrate our approach by applying the methodstoseveral regions in the world Keywords—Geo visual analytics, geotagged images, spatiotemporal analysis, movement data, clustering
Intro • Photo-sharing sites Flickr and Panoramio have billions of photos, publicly available, and annotated with metadata • Image size • Tags • Titles • Time Stamps • Geo Tags
What’s Interesting to Us? • User’s trajectory of sequence of photos(one user, photos close in time and space) • Which places are interesting to users(clusters of photos by geotags) • Events that are interesting to users (specific time interval and location range) • Result: We care a lot about timestamps as well as geotags.
Related Work • 2008 – Flickr was used to identify regions of high tourist concentrations in Rome Photo is Figure 1 from the paper
Attractiveness by Density Maps • The common and fast way to analysis of attractiveness or activity is to split a geographical region into cells, count the hits in each cell, color code the region by the count http://googlemapsmania.blogspot.com/2012/03/african-conflicts-on-google-maps.html
Related Work • 2009 – Mean-shift, a non-parametric clustering algorithm used to find the most attractive places on Earth via Flickr http://mobblog.cs.ucl.ac.uk/ 30 most photographed places in Boston
Convex Hulls • Density based clustering algorithms are a good way to find attractive areas. • Density connectivitybetween pointsusing distance anddensity thresholdsfinds clusters of photos
Analytical Framework • Formal ModelO S T A1 A2 Anwhere O is the set of objects, S is the set of places, T is the set of moments, and A1,A2,, An are additional attributes of the events • A visual representation of the data is needed to get real value from this model • Google Earth is a good tool. • Use brushing, linking, focusing to gain inferences
Data Collection • Flickr API • REST (REpresentational State Transfer) • http://www.flickr.com/services/api/flickr.photos.search.html • Many parameters can be used to narrow the search • If you don’t narrow the search, Flickr will do it without telling you • You can only get 4000 results from any flickr.photos.search query
Flickr • To get all Flickr photo metadata, you can ask how many photos in a region of the earth, subdivide it and/or time-split it until you get queries that result in less than 4000 photos • Alternate approach: Flickr has groups: given a user id, you can find others with similar interests and see what they uploaded.
Flickr Search by Bounding Box • URL:http://api.flickr.com/services/rest/?method=flickr.photos.search&api_key=36aa30d4f02fc66722ab71cbfb40e2a8&bbox=-180%2C-90%2C180%2C90&format=rest • Or:&format=json&nojsoncallback=1 JSON (JavaScript Object Notation)
Time-delimited Search of Flickr URL: http://api.flickr.com/services/rest/?method=flickr.photos.search&api_key=36aa30d4f02fc66722ab71cbfb40e2a8&max_taken_date=2012-07-07+00%3A00%3A00&bbox=-180%2C-90%2C18-%2C90&format=rest
Time-delimited Search of Flickr URL: http://api.flickr.com/services/rest/?method=flickr.photos.search&api_key=f3794ef16c22e0e96f587fc2a190170e&min_taken_date=2012-07-07+00%3A00%3A00&bbox=-180%2C-90%2C18-%2C90&format=rest
Panoramio REST User IDs run from 1 to …
Panoramio by User ID User ID • http://www.panoramio.com/map/get_panoramas.php?set=7000000&from=0&to=10&minx=-180&miny=-90&maxx=180&maxy=90&size=mini_square • {"count":2,"has_more":false,"map_location":{"lat":-0.39113999999999999,"lon":36.095782,"panoramio_zoom":0},"photos":[{"height":32,"latitude":0.39113999999999999,"longitude":36.095782,"owner_id":7000000,"owner_name":"tincin","owner_url":"http://www.panoramio.com/user/7000000","photo_file_url":"http://mw2.google.com/mwpanoramio/photos/mini_square/74216564.jpg","photo_id":74216564,"photo_title":"LakeNakuru","photo_url":"http://www.panoramio.com/photo/74216564","place_id":"9d45290864bf443d6d6112685668899c315d4050","upload_date":"22 June 2012","width":32},{"height":32,"latitude":0.39113999999999999,"longitude":36.095782,"owner_id":7000000,"owner_name":"tincin","owner_url":"http://www.panoramio.com/user/7000000","photo_file_url":"http://mw2.google.com/mwpanoramio/photos/mini_square/74216747.jpg","photo_id":74216747,"photo_title":"Flemingo in Lake Nakuru","photo_url":"http://www.panoramio.com/photo/74216747","place_id":"9d45290864bf443d6d6112685668899c315d4050","upload_date":"22 June 2012","width":32}]}
Limits • Panoramio allows 100,000 queries per day • Any more, and your API ID gets revoked. • If you want all the meta data from Panoramio,keep track of the number of queries in the last 24 hours, throttle your app.