Download
1 / 44
440 likes | 567 Views
A Framework for Network Monitoring and Performance Based Routing in Distributed Middleware Systems. Gurhan Gunduz (ggunduz@syr.edu) Advisor: Professor Geoffrey Fox. Outline. Motivation Research issues Overview of Performance based dynamic routing system Network monitoring framework

E N D
A Framework for Network Monitoring and Performance Based Routing inDistributed Middleware Systems Gurhan Gunduz (ggunduz@syr.edu) Advisor: Professor Geoffrey Fox
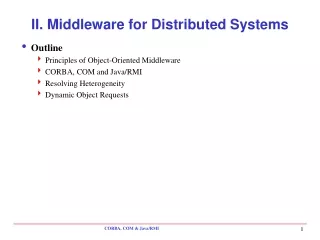
Outline • Motivation • Research issues • Overview of Performance based dynamic routing system • Network monitoring framework • Aggregation framework • Dynamic routing framework • Related work • Conclusion and future work
Motivation I • Tango experience in Syracuse • Suffered from bad network performance • Packets travel from Syracuse to the west cost and then back to Mississippi. • Impossible to re-route traffic using hardware routers
Research Issues • We investigate the question of how to develop a performance based dynamic routing system. • De-centralized • Scalable • Hardware independent • We identify 4 core research issues for a complete performance based dynamic routing system and investigate related issues; • Performance monitoring • Aggregation of measured metrics • Distribution of performance metrics to relevant locations • Dynamic routing
Performance Based Dynamic Routing • Our framework has the following components • Monitoring Scheme • Monitor the network and gather the performance metrics • Aggregation Scheme • Aggregate the performance measurements from monitoring services • Store them into database. • Distribute performance metrics to relevant locations • Updates the link costs in the system with the ones calculated by the performance monitoring system • Dynamic routing scheme • Uses the new costs to dynamically update routes in the system • We chose NaradaBrokering distributed broker system to implement our ideas • Open source • Ideas developed here are applicable to other networking and messaging infrastructures
Well Known Systems • Network Weather Service is a well known performance monitoring tool • Monitor TCP/IP, CPU load and available memory • Predicts the future performance • Does not have dynamic routing feature • No support for protocols other than TCP/IP • Does not use messaging infrastructure • Monitoring Agents in A Large Integrated Services Architecture(MonALISA) • Distributed monitoring service • Gets performance metrics from SNMP (Simple Network Management Protocol)
NaradaBrokering • Distributed event brokering system designed to run on a large network of cooperating broker nodes. • NB uses enterprise service bus style network overlay technology. • It constructs a logical overlay network on top of the underlying network. • Organizes nodes into clusters, super-clusters, super-super-clusters to achieve efficient routing/dissemination schemes. • Communication in NaradaBrokering is asynchronous. • NaradaBrokering provides support for JMS, P2P interactions, grid services, A/V conferencing while supporting communication through firewalls and proxies
Performance Monitoring System I • Measures the performance of the links originating from a node. • Every node incorporates the performance monitoring system • De-centralized algorithm • Improves scalability • New nodes can be added to the system without the need to interact with a centralized coordinating unit
Performance Monitoring System II • Each node could have several links that use different transport protocols for communication • Need to have transport independent design • New transports can be added easily • Nodes can start/stop performance measurements either for a given link or the entire set of links at that node
Performance Monitoring System III • Measurement initiator module controls all the performance monitoring activities at a given node • Monitored link structure has been created to enable transport protocols to perform performance measurements. • Abstract class • Supported transports are; • SSL, HTTP, HTTPS, TCP, NIO TCP, UDP
What are the Measured Network Metrics • Latency • Transit delay from a source to a destination • Jitter • Measure how the spacing between successive messages over a given link varies • Loss rates • Number of messages that are lost in transit between the source and the destination
Measuring Performance Metrics • Loss rates are computed based on received responses and the lack thereof • Latencies are computed based on time stamps • Incorporates support for outlier removal • Jitter is computed based on the delays between successive messages
Frequency of Measurements • Frequency of measurements are controlled by the performance monitoring system • High frequency measurements could corrupt the metrics being measured • Generates unnecessary traffic • Low frequency measurement could miss some short time bursts
Performance Aggregation System • Aggregates the performance metrics from nodes which incorporates the performance monitoring system. • Performance monitoring system reports performance data to a performance aggregation node • Performance metrics are encapsulated in XML and sent to the aggregation nodes
Encapsulating performance data • Performance monitoring system encapsulates performance data in an XML format. • Why XML; • Easy access to relevant fields in the performance data. • Description capability of the content provides support for intelligent data mining through the use of XPATH queries • Thanks to XML structure, it is easy to incorporate results gathered from another network monitoring services such as NWS and it is easy for other systems to use our performance metrics • Disadvantage • Causes an overhead
Storing Performance Data • Flat files • No additional database required • Slow for large data • Easy to display on portals using XSLT which converts a given XML file into HTML using the given XSL style sheet • Database • Relational database program is needed • MySQL • The performance data is stored in non-XML format • Fast searches on data by using SQL queries
Data Mining • Stored data can be mined to identify, circumvent, project and prevent system bottlenecks. • Check metrics for thresholds and Inform nodes to take actions to correct situation • Frequency of performance measurements can be lowered or increased • Measurement can be stopped • Number of links can be reduced
Finding the Best Routes • NaradaBrokering organizes nodes into clusters, super-clusters, super-super-clusters to achieve efficient routing/dissemination schemes. • Broker Network Map (BNM) • Each broker maintains its own BNM • Abstract view of broker network • Provides information regarding the inter-connections between brokers in the cluster • Ensure the calculation of optimal paths
Link Cost • Link costs are computed based on the metrics found by the performance monitoring system • LinkCost=Overall_coeff+Latency_Coeff*Latency+ PKT_LOSS_COEF*lossrate+JITTER_COEF*jitter • Link cost formula can be modified to favor specific metrics • Audio and video applications require good jitter, so jitter coefficient can be increased • These link costs should be disseminated within the system to update existing link costs • Updated costs are used to find the best routes in the system
Dissemination of Link Costs I • Dissemination should be carefully done since the number of the links could be really high • Threshold values are used to check if the new link costs are worth propagating • Each link in the system has unique ID. • Universally Unique Identifier (UUID) is used to generate unique IDs • Prevents conflicts • Topic based publish/subscribe scheme is used for dissemination • Link ID, new link cost and the topic name are put into the message before publishing it.
Dissemination of New Link Costs II • Interested nodes subscribe to a specific topic to get the measured costs for the links • It is a loosely-coupled system • Publishers and subscribers do not know each other • Increases scalability • New nodes can be added easily
Testing the System • There are two routes from node 2 to node 3: • 213 • Cost is 86 • 243 • Cost is 3
Testing the system • 2654 • Cost is 131 • 234 • Cost is 32
Related Work I • There are several disjoint activities on network performance and characteristic monitoring for the grid. • Existing network monitoring systems tend to use the well known measurement engines (PingER, IPERF, UDP throughput, FTP throughput) • Each implement context specific framework and visualization • All speak different languages
Related Work II • Network Weather Service • Monitors network, CPU and memory performances • Only TCP protocol • Make forecasts • Self configuring network monitor project has a hardware infrastructure to monitor the network. • DataGrid EDG project—site-to-site monitoring and publication to Relational Grid Monitoring Architecture • UK e-science monitoring infrastructure—aggregate traffic statistics (available on an ad hoc basis form core providers.) • There are Peer-to-Peer applications which implements dynamic routing • Skype uses intelligent routing to route calls through best possible paths
Summary of Contributions • Designing and implementing a complete framework for scalable, de-centralized, and hardware independent performance based dynamic routing system which consists of performance monitoring system, aggregation system and dynamic routing system • Proposing an architecture for transport protocol independent monitoring framework • Designing an efficient and scalable way of disseminating new costs within the system • Investigating the issues related to the frequency of measurements and the overhead caused by the performance based dynamic routing system.
Future Work • More sophisticated deployment of statistical and data mining techniques • XML and object databases could be investigated to see how they work with our system • User interface that increases the interaction with the administrators can be developed.