Download
1 / 23
230 likes | 515 Views
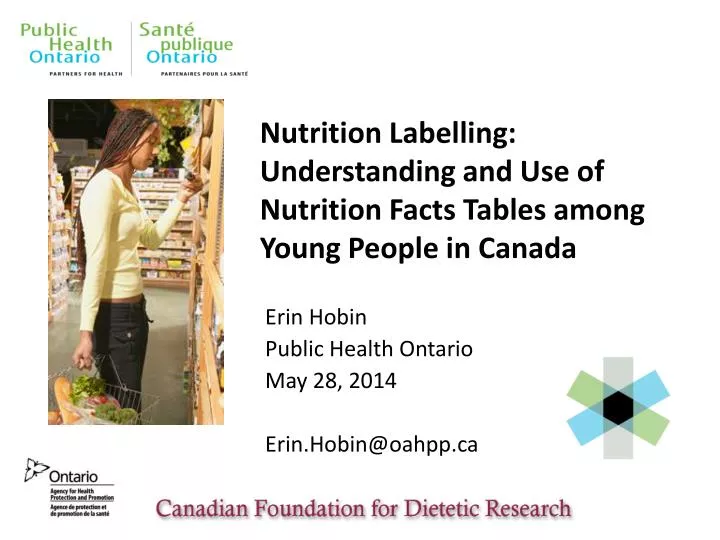
Nutrition Labelling: Understanding and Use of Nutrition Facts Tables among Young People in Canada. Erin Hobin Public Health Ontario May 28, 2014 Erin.Hobin@oahpp.ca. Background.

E N D
Nutrition Labelling: Understanding and Use of Nutrition Facts Tables among Young People in Canada Erin Hobin Public Health Ontario May 28, 2014 Erin.Hobin@oahpp.ca
Background • Dietary patterns are associated with nutrition-related chronic diseases such as obesity, diabetes, cardiovascular disease, and cancer • Poor dietary patterns among adolescents and young adults in Canada
Previous Research • Not a single published study in Canada has examined the understanding and use of NFts among young people
Primary Research Objective To investigate if and how young people in Canada comprehend and use serving size and %DV information on the current and modified NFts when choosing and comparing foods.
STUDY 1used qualitative methods to explore the process by which young people engage with, understand, and use serving size and %DV information on the current and modified NFts. STUDY 2consists of a quantitative survey with 2,000 participants between the ages of 16-24 years from across Canada.
Stimulus Conditions **HIGH = ≥ 15% DV per serving; LOW = ≤ 5% DV per serving
CONDITION #5 Product A Product B
STUDY 1 Design Overview: • Verbal Protocol + semi-structured interviews within randomized stimulus conditions and asked to “think aloud” while participating in 2 Behavioural Tasks • 26 participants • 50% 16 – 18 years / 19 – 24 years • 50% Male / Female • June – August 2013
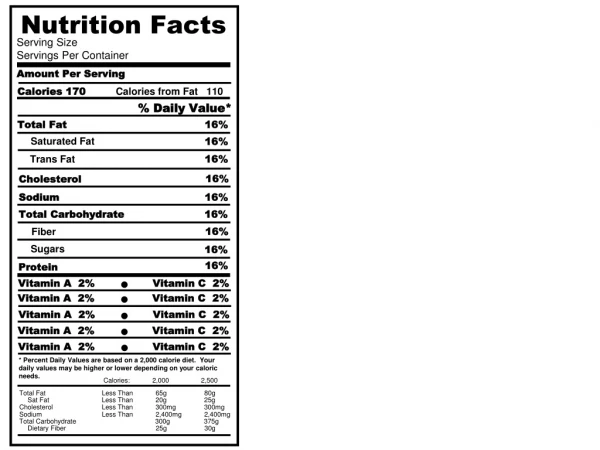
Task #2: Functional Survey with NFts “More than the other product.”
Key take-away message • Standard serving sizes across similar products can support food choices and more prescriptive information leaves less for interpretation and places information into context.
Relevance • Aligned with several food-related recommendations made in the Healthy Kids Report section 2.5. • Results can provide evidence to support more effective regulatory changes to Nutrition Facts tables. • Translate findings to communicating nutrition information on front-of-package and menu labelling initiatives. • Guide school curricula.
Next Steps • Conduct Study 2 – online survey with 2,000 participants across Canada • Expose participants to same 6 experimental conditions testing current NFT compared to standardized serving sizes and simple descriptors and colours to interpret %DV information • Specific applications of NFtsuch as more prominent display of calories, including “added sugars” information
RESEARCH TEAM • Dr. David Hammond Associate Professor, U Waterloo • Dr. Erin Hobin Scientist, Public Health Ontario • Dr. Judy Sheeshka RD, Professor, Victoria University • Ms. Mary FodorO’Brien RD, Public Health Ontario • Dr. Gail McVey Scientist, Hospital for Sick Kids Food and Nutrition Experimental Design and Survey Methods Qualitative Methods and Think Aloud Young People TIMELINE: September 2012 through to July 2014
ACKNOWLEDEMENTS Funding for this study was provided through a Research in Action grant from: Dr. Grace Shen-Tu, practicum student at PHO Christine White, Program Manager, Propel Centre for Population Health Impact
Thank you for listening E: Erin.Hobin@oahpp.caT: 647-260-7198
Task #2: Functional Survey with NFts “I don’t know what the daily value is.”
Task #2: Functional Survey with NFts “You should always get 100% DV.”
Task #2: Functional Survey with NFts “High” indicates high amount.”