Download
1 / 18
180 likes | 266 Views
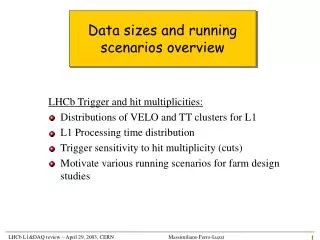
Data sizes and running scenarios overview. LHCb Trigger and hit multiplicities: Distributions of VELO and TT clusters for L1 L1 Processing time distribution Trigger sensitivity to hit multiplicity (cuts) Motivate various running scenarios for farm design studies. Current Baseline Scenario.

E N D
Data sizes and running scenarios overview LHCb Trigger and hit multiplicities: • Distributions of VELO and TT clusters for L1 • L1 Processing time distribution • Trigger sensitivity to hit multiplicity (cuts) • Motivate various running scenarios for farm design studies
Current Baseline Scenario L1/DAQ CPU farm designed for following averages: • L1 input rate 1.1 MHz • L1 output rate 40 KHz • L1 CPUs ~ 500 • HLT CPUs ~ 700 • L1 processing time ~ 0.5 ms • HLT processing time ~ 17.5 ms • L1 uses VELO + TT + L0 objects • HLT uses as L1 + Calo, Muon, Trackers BUT: what if hit multiplicities are larger than expected ? … larger data sizes, larger processing times. What can we do ?
Trigger and Multiplicities Rate (a.u) • Because of inefficiencies (pattern recognition), offline signal content goes down at large multiplicities. • Events at large multiplicities consume more CPU time and put more data through the network. • The idea: try to replace those events a.s.a.p. (i.e. at L0) by lower multiplicity events. SPD multiplicity
L1VeloTrackAlg Time distributions Brunel v14r2 tav t no_cut Mean and RMS in NSPD-bin
L0 and SPD multiplicity cut Bs J/ (e+e-) Brunel v14r2 (fall 2002 production) L0 output fixed at 1MHz 1MHz L0 can cope with a multiplicity cut. What about L1 ?
Sensitivity of L0*L1 to multiplicity: a first look • Apply a given cut on SPD multiplicity at L0 • Each time, re-adjust L0 thresholds to get always the same L0 minimum bias retention rate • Pass events to L1 and re-adjust threshold on L1 global variable to get always the same L1 minimum bias retention rate
Brunel v14r2 L1 versus VELO clusters • Small fraction of events with more than (say) 2500 clusters in L0yes MBIA and in offline-selected L0yes signal events • But large fraction ofL1 time spent on those MBIA events! Evt fraction with more than Nvc velo clusters Time (a.u.) spent on evts with Nvc velo clus.
Scenarios for farm studies So far, we considered three scenarios (with a fixed # of CPUs): • Sc1: Baseline scenario: • L1 processing time scaled such that average is ~0.5 ms. • HLT processing time scaled such that average is ~17 ms. • L1 output rate = 40 kHz, using only TT+VELO+L0. • 500 L1 CPUs + 700 HLT CPUs. • Sc2: Upgrade scenario: • L1 processing time scaled such that average is ~1 ms. • HLT processing time scaled such that average is ~17 ms. • L1 output rate = 12 kHz, using TT+VELO+L0+Trackers ( + Calo sel. crate, muon ). • 1000 L1 CPUs + 200 HLT CPUs. • Sc3: Robustness check: • Suppose all processing times are a factor ~1.5 higher than in the Sc1... So, apply multiplicity cuts at L0 (NSPD<180 and NPU<80) to recover the same average for L1 time (0.5 ms), while preserving a reasonable signal efficiency. L0 and L1 thresholds readjusted to keep the nominal L0 and L1 retention rates. This is similar to assuming that we have only 2/3 of the CPUs available compared to baseline. Use “realistic” data ( = full simulation, with noise, clusters per L1 board, etc.), including CPU processing time. (4.4M minimum bias events)
L1 time and number of clusters Sc1 (baseline) Sc3 (multipl. cut), before re-scaling time Considerable gain in average time and data size with small signal efficiency loss. L1 processing time (a.u.) Sum of all L1 TT+VELO clusters
Summary and Outlook • There seem to be no offline-selected signal events above a certain multiplicity • L0*L1 quite sensitive to multiplicity cut • Multiplicity cuts offer possibility to reduce average and tails of • processing time in L1&DAQ farm, • amount of data we put through the network with little loss on signal efficiency (to be confirmed by multichannel study) • SPD + Pile-Up Veto (at L0) and Velo (at L1) multiplicities can be used as an additional handle to counter “unexpected adversity” from mother nature • Various scenarios under study
Brunel v17r4 L0-yes MBIA Look at L1 Time for various multiplicity cuts on VELO clusters • Make as if applying a cut at the “entrance” of L1 processing: • if #L1Clusters>value then L1-no and set L1 time = 0.
L1L0 Global Performance vs multiplicity cuts • Still Brunel v16r4 (Xmas) • Apply both PU and SPD multiplicity cuts • Rescale L0 thresholds and L1global to get proper MBIA retentions • Only 1 physics channel looked at… • …this is just a start.
Same but with additional Velo clusters cut Apply a cut on number of Velo clusters at entrance of L1: < 2000.
L1 versus VELO clusters From Frederic Teubert @LHCC What if the Minimum Bias multiplicity is wrong? Subdivide the Minimum Bias sample in: tracks < 40 40 < tracks < 70 70 < tracks B0s Ds-K+ If the multiplicity is ~70% higher, the signal efficiency is reduced by ~30%.
L1 versus VELO clusters Thanks to Frederic Teubert Bs Ds K L0>0 L0>0 && L1>0 Bs Ds Bd L0>0 && L1>0 && SEL>0 Bs (ee) Bd K* Bs ()
L1 vs VELO clusters Thanks to Frederic Teubert Velo < 2.2k clusters Status at LHCC
Two scenarios: L1 time and number of clusters baseline What impact on farm design ? Robustness check Scaled L1 time (s) Sum of all L1 TT+VELO clusters (Note: here real L1veloclusters; previous slides, offline Velo clusters)