Download

1 / 5
50 likes | 117 Views
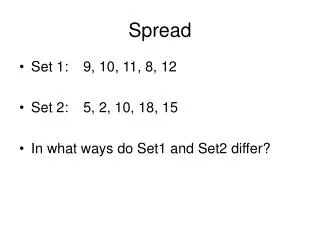
Spread Sheet Evidence. Lucy Woods. Firstly I inputted all the results that I obtained from my questionnaire under the relevant column titles and insured I had a drop down box created by data validation for each individual cell.

E N D
Spread Sheet Evidence Lucy Woods
Firstly I inputted all the results that I obtained from my questionnaire under the relevant column titles and insured I had a drop down box created by data validation for each individual cell. Each cell had various options that could be imputed to avoid incorrect answers being entered.
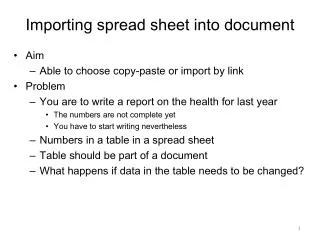
Testing the Validation Rule • By imputing a value that did was not acceptable for that specific field this warning notice appeared showing that my validation rule works.
From the results I obtained I then had to find the percentage of people who gave each answer. This was achieved by using a ‘COUNTIF’ statement. A COUNTIF statement the range of cells that you want to count based on the criteria and gives less chance of human error. In this case to obtain the number of males that took park in the survey I did the equation =COUNTIF( gender, “Male”).
I then decided to display my results in a pie chart and annotated them describing what the results showed.