Download
1 / 32
340 likes | 469 Views
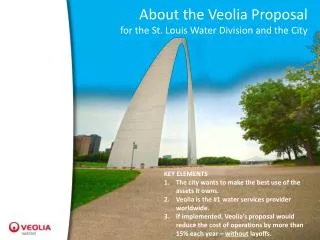
Designing the Future for the St. Louis Water Division and the City. The vision…. “But we as Water Works men cannot live in the past or in the present. It is we who live 20 to 30 years in the future. It has been always thus, except that now the pace is faster.” - Water Division website.

E N D
Designing the Future for the St. Louis Water Division and the City The vision… “But we as Water Works men cannot live in the past or in the present. It is we who live 20 to 30 years in the future. It has been always thus, except that now the pace is faster.” - Water Division website
Water Division customer base has declined City population (in millions) -63%
St. Louis water revenue vs. expense now 2009 Rate increase 2008 Rate increase Expense 19% 11% Revenue Millions of $ SOURCE: St. Louis Annual Operating Plans 2010, 2011, 2012 and 2013
You are about to lose your most valuable resources Today, 1/3 of workforce eligible to retire Retirement eligible
Delayed repairs and replacements are increasing capital needs Capital needed (repair/replacements delayed) Unfunded Projects Cost (in millions of $) Funded Projects SOURCE: Black & Veatch Report
Our unique approach ensures success for St. Louis • Peer-to-peer:Full-spectrum utility operations is what we do; we are your peer in all aspects. • Comprehensive evaluation: Our evaluation respects the interconnected elements of operations. • Efficiency implementation specialists: We are focused on implementing operational efficiencies– regulated utilities and traditional consultants don’t have to be. • Proven savings: We have track record of successful projects in NYC, Indy and Pittsburgh. 6
Veolia Water’s St. Louis team includesfive city-certified M/WBE partners and Jacobs Engineering Distribution system assessment, management technologies Condition assessment of equipment, overall energy footprint Water audit, bulk sales, evaluation of system capacity Audit of procurement, inter-department charges External and media communications Organizational development, strategy planning, facilitation Our M/WBE partners bring over 100years combined service to the community 7
We are a strongly local team, with 650 area employees (225 from Veolia and 425 from partner firms) 9employees: Veolia Water 13employees: Veolia Water 5employees: Randle & Assoc. 15employees: AFRAM Corp. 16employees: Veolia Energy 353employees: Jacobs Engineering 7employees: Hauser Group 7employees: Vector Comm. 187employees: Veolia Environmental Services 68employees: ABNA Engineering
Our expertise has enabled us to find and implement “quick wins”for our clients Chemical Procurement $750,000 in estimated annual savings Meter Change Out $2,050,000 in new annual revenue Fee Implementation $450,000 in estimated new annual revenue
If selected for implementation, we will help you achieve up to $8.8 million in annual benefit (savings and new revenue) $130million annually (up to 10.8% of budget) $9million annually (achieved 18%) $8million annually (up to 15%) Up to $30million over a 5-year implementation
Our Phase 1 assessment will identify improvement opportunities across the Water Division’s entire budget • Vehicle maintenance and replacement analysis for a more reliable fleet 4% of Total Cost 7% of Total Cost 20% of Total Cost 29% of Total Cost 40% of Total Cost Cost (in millions of $)
Reducing equipment costs: We transformed Buffalo Water’s approach to maintenance; a similar strategy may work here Buffalo, NY fleet transformation • 170 vehicles (one vehicle to 1.8 employees) • Average age 11.6 years • $462,507 vehicle maintenance last year averaged $3,919 for 118 vehicles listed • 32 of the vehicles averaged $9,300 each • Blanket PO authorize additional $188,000 for repair and rentals St. Louis opportunity Reduced fleet 11% Replaced 34% of fleet for the same cost as repairing older equipment
Our Phase 1 assessment will identify improvement opportunitiesacross the Water Division’s entire budget 4% of Total Cost • Better asset management and advanced predictive tools to minimize capital expenditures 7% of Total Cost 20% of Total Cost 29% of Total Cost 40% of Total Cost Cost (in millions of $)
Renewal Year Reducing future debt: Our study will evaluate opportunities for technology-based efficiencies in preventive maintenance City GIS pipe data InfoNet + MOSARE Predictive tool color codes replacement schedule based upon a complex pipe-break algorithm
If implemented, this predictive technology helps target capital, saves overtime dollars and reduces outages average Avoid emergency repairs in the middle of the night at overtime rates Our approach uses data such as breakage rates by pipe type and age, to target trouble areas
Our Phase 1 assessment will identify improvement opportunitiesacross the Water Division’s entire budget 4% of Total Cost 7% of Total Cost • More efficient electric consumption could save 10% or $270k in power 20% of Total Cost 29% of Total Cost 40% of Total Cost Cost (in millions of $)
Reducing material costs: We used the Department of Energy’s Pumping System Assessment Tool to save money in Indy $160K annual savings on power and heating $250K initial cost for Variable Frequency Drive and ductwork 40% reduction in carbon usage $90K annual savings
Reducing materials costs starts with a total water assessment for more accurate production requirement 12% unmetered vs. 45% in St. Louis average Water conservation saves resources
Our Phase 1 assessment will identify improvement opportunitiesacross the Water Division’s entire budget 4% of Total Cost 7% of Total Cost 20% of Total Cost • Improved processes, selection and requirements can save nearly $2 million 29% of Total Cost 40% of Total Cost Cost (in millions of $)
Reducing contracts costs: We identified chemical savings in purchasing and dosage for NYC • Purchasing and selection • Usage and dosing strategies New York City DEP Commissioner Strickland shares the good news of $8 to $9 million in savings created within the first nine months, with a large part due to chemical savings St. Louis opportunity
Our Phase 1 assessment will identify improvement opportunitiesacross the Water Division’s entire budget Managed attrition with succession planning and training saving $3 million annually 4% of Total Cost 7% of Total Cost 20% of Total Cost 29% of Total Cost 40% of Total Cost Cost (in millions of $)
You are about to lose your most valuable resources Today, 1/3 of workforce eligible to retire Retirement eligible
Reducing personnel costs through attrition and insourcing: We streamlined the operation in Indy without layoffs • Attrition and voluntary changes reduced staff 28% in 9 years + + Restructure/ Work Redesign SOPs Train
Our Phase 1 assessment will identify improvement opportunities across the Water Division’s entire budget 4% of Total Cost 7% of Total Cost 20% of Total Cost Reinvest and stabilize rates 29% of Total Cost 40% of Total Cost Up to $6.5 million saved annually Cost (in millions of $)
Our comprehensive analysis of the Water Division will include an assessment of revenue enhancement potential • Metered customers represent 16% of all customers but 44% of revenue • Other new revenue sources • Sensitivity to customers: • Communication with large users • The Hauser Group SOURCE: KPMG 2010
Our organizational structure promotes collaboration and staff buy-in through all levels of the program Steering Committee Steve Siegfried David Gadis TBD Water Division department leads Curt Skouby Sam Dotson David Carter Jim Sondermann TBD Program Manager/ Phase 1 Study Veolia Water North America Executive VP Veolia Water North America Vice President Veolia Water Central Region Comptroller’s Appointee City of St. Louis Deputy Commissioner City of St. Louis COO City of St. Louis Water Commissioner City of St. Louis President of the Board of Aldermen’s Appointee City of St. Louis Project Management Team Working Teams Veolia Water team specialists
A collaborative peer-to-peer approach creates a “Made-in-St. Louis” solution 11 Veolia Water Staff working with NYC DEP Management Team to find improvements.
As requested by your RFP, our Phase 1 study will be completed in four months Phase 1 Project setup and top down assessment (if selected) Phase 2 Plan improvements, then implement Phase 3 Validate savings, continue • Total cost: $250,000 • Duration: 4 months • Total cost and duration: To be negotiated (initiative dependent) • Total cost and duration: To be negotiated (initiative dependent)
If selected we will help you implement sustainable improvements, building the Utility of the Future Value Service • Indy 5-year rate freeze • Customer service excellence • Incoming calls (85% within 30 seconds) • Call abandons (4%) • Collections (99%) SVR • ISO 14001 and 9001 achieved in Indy • Safety excellence • Environmental Sustainability • Water Quality Responsibility
The Utility of the Future will benefit from the Veolia Water network of expertise and results delivered to our clients Buffalo – saving $1 million each year and greatly improved customer service Indy – saved $83.1 million NYC – saving up to $130 million Atlanta/Fulton County – developed M/WBE firms in award-winning partnership Tampa Bay Water – savings featured on CNN Money 550 Communities currently being served in North America
Our unique approach ensures success for St. Louis • Peer-to-peer:Full-spectrum utility operations is what we do; we are your peer in all aspects. • Comprehensive evaluation: Our evaluation respects the interconnected elements of operations. • Efficiency implementation specialists: We are focused on implementing operational efficiencies– regulated utilities and traditional consultants don’t have to be. • Proven savings: We have track record of successful projects in NYC, Indy and Pittsburgh.
QUESTIONS? 32