Download
1 / 16
160 likes | 335 Views
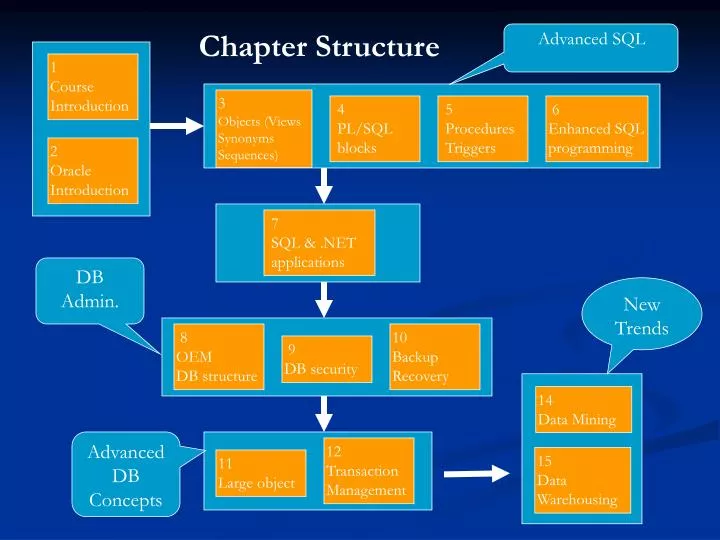
1 Course Introduction. 3 Objects (Views Synonyms Sequences). 4 PL/SQL blocks. 5 Procedures Triggers. 6 Enhanced SQL programming. 2 Oracle Introduction. 7 SQL & .NET applications. 8 OEM DB structure. 10 Backup Recovery. 9 DB security. Chapter Structure. Advanced SQL.

E N D
1 Course Introduction 3 Objects (Views Synonyms Sequences) 4 PL/SQL blocks 5 Procedures Triggers 6 Enhanced SQL programming 2 Oracle Introduction 7 SQL & .NET applications 8 OEM DB structure 10 Backup Recovery 9 DB security Chapter Structure Advanced SQL DB Admin. New Trends 14 Data Mining Advanced DB Concepts 12 Transaction Management 15 Data Warehousing 11 Large object
Data Mining – Business Intelligence • Data explosion problem • We are drowning in data, but starving for knowledge! • Finding interesting structure in data (data-driven decision making practices, BBC Horizon - Age of Big Data ) • Structure: refers to statistical patterns, predictive models, hidden relationships • To provide knowledge that will give a company a competitive advantage, enabling it to earn a greater profit
Purpose of Data Mining • Goals of data mining • Predict the future behavior of attributes • Classify items, placing them in the proper categories • Identify the existence of an activity or an event • Optimize the use of the organization’s resources
Applications of Data Mining • Retailing • Customer relations management (CRM) • Advertising campaign management • Banking and Finance • Credit scoring • Fraud detection and prevention • Manufacturing • Optimizing use of resources • Manufacturing process optimization • Product design • Medicine • Determining effectiveness of treatments • Analyzing effects of drugs • Finding relationships between patient care and outcomes • Higher Education (Academic analytics) • which students will enroll in particular course programs • which students will need assistance in order to graduate
Commercial Support and Job Market • Many Data Mining Tools • http://www.kdnuggets.com/ • Database systems with data mining support • Oracle 10g, 11g • SQL Server 2005, 2008 • Hot topic • http://groups.yahoo.com/group/datamining2/ • 2677 members by April. 14, 2009
BI Market Worldwide BI software revenue is forecast to reach almost US$12.5 billion in 2012, up 7.2 percent over last year. The global BI software and services market will rapidly expand from $79 billion in 2012, to $143 billion in 2016
Data Mining and Business Intelligence Increasing potential to support business decisions End User Making Decisions Data Presentation Visualization Business Analyst Data Mining Information Discovery Data Analyst Data Exploration Statistical Analysis, Reporting Data Warehouses/Data Marts OLAP, MDA DBA Data Sources Paper, Files, Database systems, OLTP, WWW
Data Mining Methods(6 basic classes) • Associations • Finding rules like “if the customer buys frozen Pizza, sausage, and beer, then the probability that he/she buys potato chips is 50%” • Classifications • Classify data based on the values of the decision attribute, e.g. classify patients based on their “state” • Clustering • Group data to form new classes, cluster customers based on their behavior to find common patterns
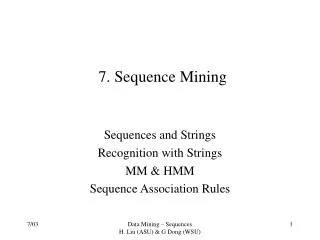
Data Mining Methods • Sequential patterns • Finding rules like “if the customer buys TV, then, few days later, he/she buys camera, then the probability that he/she will buy within 1 month video is 50%” • Time-Series similarities • Finding similar sequences (or subsequences) in time-series (e.g. stock analysis) • Deviation detection • Finding anomalies/exceptions/deviations in data
Association and Classification Rules • Association rules have form {x} {y}, where x and y are events that occur at the same time. • Have measures of support and confidence. • Support is the percentage of transactions that contain all items included in both left and right sides • Confidence is how often the rule proves to be true; where the left hand side of the implication is present, percentage of those in which the right side is present as well • Classification rules, placing instances into the correct one of several possible categories • Developed using a training set, past instances for which the correct classification is known • System develops a method for correctly classifying a new item whose class is currently unknown
Sequential Patterns • Sequential patterns e.g. prediction that a customer who buys a particular product in one transaction will purchase a related product in a later transaction • Can involve a set of products • Patterns are represented as sequences {S1}, {S2} • First subsequence {S1} is a predictor of the second subsequence {S2} • Support is the percentage of times such a sequence occurs in the set of transactions • Confidence is the probability that when {S1} occurs, {S2} will occur on a subsequent transaction - can calculate from observed data
Time Series Patterns • A time series is a sequence of events that are all of the same type • Sales figures, stock prices, interest rates, inflation rates, and many other quantities can be analyzed using time series • Time series data can be studied to discover patterns and sequences • For example, we can look at the data to find the longest period when the figures continued to rise each month, or find the steepest decline from one month to the next
Data Mining Methods: Regression • A statistical method for predicting the value of an attribute, Y, (the dependent variable), given the values of attributes X1, X2, …, Xn (the independent variables) • Statistical packages allow users to identify potential factors for predicting the value of the dependent variable • Using linear regression, the package finds the contribution or weight of each independent variable, as coefficients, a0, a1, …, an for a linear function Y= a0 + a1 X1 + a2 X2 + … + anXn • Can also use non-linear regression, using curve-fitting, finding the equation of the curve that fits the observed values
Neural Networks • Methods from AI using a set of samples to find the strongest relationships between variables and observations • Use a learning method, adapting as they learn new information • Hidden layers developed by the system as it examines cases, using generalized regression technique • System refines its hidden layers until it has learned to predict correctly a certain percentage of the time; then test cases are provided to evaluate it • Problems: • overfitting the curve - prediction function fits the training set values too perfectly, even ones that are incorrect (data noise) • Knowledge of how the system makes its predictions is in the hidden layers • Output may be difficult to understand and interpret
Clustering • Methods used to place cases into clusters or groups that can be disjoint or overlapping • Using a training set, system identifies a set of clusters into which the tuples of the database can be grouped • Tuples in each cluster are similar, and they are dissimilar to tuples in other clusters • Similarity is measured by using a distance function defined for the data
Data Mining Process • Data preprocessing • Data selection: Identify target datasets and relevant fields • Data cleaning • Remove noise and outliers • Data transformation • Create common units • Generate new fields • Data mining model construction • Model evaluation