Download
1 / 26
290 likes | 540 Views
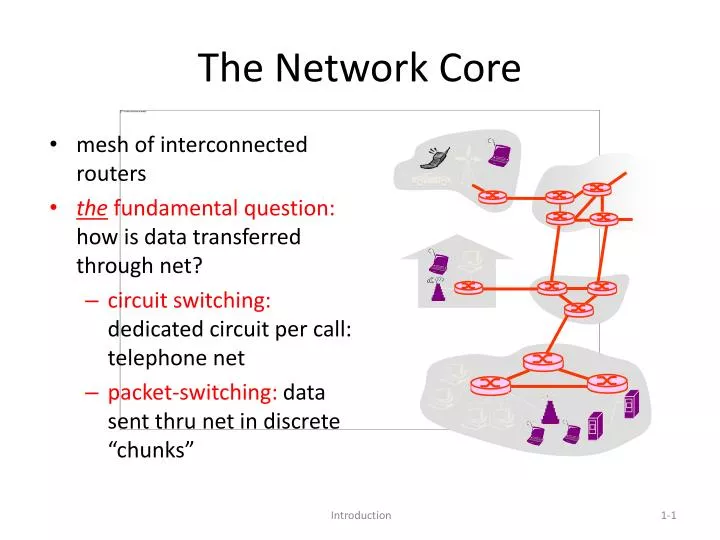
mesh of interconnected routers the fundamental question: how is data transferred through net? circuit switching: dedicated circuit per call: telephone net packet-switching: data sent thru net in discrete “chunks”. The Network Core. End-end resources reserved for “call”

E N D
mesh of interconnected routers the fundamental question: how is data transferred through net? circuit switching: dedicated circuit per call: telephone net packet-switching: data sent thru net in discrete “chunks” The Network Core Introduction
End-end resources reserved for “call” link bandwidth, switch capacity dedicated resources: no sharing circuit-like (guaranteed) performance call setup required Network Core: Circuit Switching Introduction
Example: 4 users FDM frequency time TDM frequency time Circuit Switching: FDM and TDM Introduction
Numerical example • How long does it take to send a file of 640,000 bits from host A to host B over a circuit-switched network? • All links are 1.536 Mbps • Each link uses TDM with 24 slots/sec • 500 msec to establish end-to-end circuit Let’s work it out! Introduction
each end-end data stream divided into packets user A, B packets share network resources each packet uses full link bandwidth resources used as needed Bandwidth division into “pieces” Dedicated allocation Resource reservation Network Core: Packet Switching resource contention: • aggregate resource demand can exceed amount available • congestion: packets queue, wait for link use • store and forward: packets move one hop at a time • Node receives complete packet before forwarding Introduction
Sequence of A & B packets does not have fixed pattern, bandwidth shared on demand statistical multiplexing. TDM: each host gets same slot in revolving TDM frame. D E Packet Switching: Statistical Multiplexing 100 Mb/s Ethernet C A statistical multiplexing 1.5 Mb/s B queue of packets waiting for output link Introduction
takes L/R seconds to transmit (push out) packet of L bits on to link at R bps store and forward: entire packet must arrive at router before it can be transmitted on next link delay = 3L/R (assuming zero propagation delay) Example: L = 7.5 Mbits R = 1.5 Mbps transmission delay = 15 sec Packet-switching: store-and-forward L R R R more on delay shortly … Introduction
1 Mb/s link each user: 100 kb/s when “active” active 10% of time circuit-switching: 10 users packet switching: with 35 users, probability > 10 active at same time is less than .0004 Packet switching allows more users to use network! Packet switching versus circuit switching N users 1 Mbps link Q: how did we get value 0.0004? Introduction
Binomial Distribution Weisstein, Eric W. "Binomial Distribution." From MathWorld--A Wolfram Web Resource. http://mathworld.wolfram.com/BinomialDistribution.html
great for bursty data resource sharing simpler, no call setup excessive congestion: packet delay and loss protocols needed for reliable data transfer, congestion control Q: How to provide circuit-like behavior? bandwidth guarantees needed for audio/video apps still an unsolved problem (chapter 7) Is packet switching a “slam dunk winner?” Packet switching versus circuit switching Q: human analogies of reserved resources (circuit switching) versus on-demand allocation (packet-switching)? Introduction
roughly hierarchical at center: “tier-1” ISPs (e.g., Verizon, Sprint, the New AT&T, Cable and Wireless), national/international coverage treat each other as equals Complete graph - Wikipedia, the free encyclopedia http://en.wikipedia.org/wiki/Complete_graph Screen clipping taken: 9/4/2007, 10:30 PM Tier-1 providers interconnect (peer) privately Internet structure: network of networks Tier 1 ISP Tier 1 ISP Tier 1 ISP Introduction
POP: point-of-presence to/from backbone peering … …. … … … to/from customers Tier-1 ISP: e.g., Sprint Introduction
Chapter 1: roadmap 1.1 What is the Internet? 1.2 Network edge • end systems, access networks, links 1.3 Network core • circuit switching, packet switching, network structure 1.4 Delay, loss and throughput in packet-switched networks 1.5 Protocol layers, service models 1.6 Networks under attack: security 1.7 History Introduction
packets queue in router buffers packet arrival rate to link exceeds output link capacity packets queue, wait for turn packet being transmitted (delay) packets queueing (delay) free (available) buffers: arriving packets dropped (loss) if no free buffers How do loss and delay occur? A B Introduction
1. Nodal processing: check bit errors determine output link(forwarding) Place in queue 2. Queueing time waiting at output link for transmission depends on congestion level of router Four sources of packet delay • 3. Transmission Delay • R=link bandwidth (bps) • L=packet length (bits) • time to send bits into link = L/R • 4. Propagation Delay • d – distance or length of physical link • s – speed ~ 2x10⁸ m/s • Delayprop = d/s Note: s and R are very different quantities! Introduction
cars “propagate” at 100 km/hr toll booth takes 12 sec to service car (transmission time) car~bit; caravan ~ packet Q: How long until caravan is lined up before 2nd toll booth? Time to “push” entire caravan through toll booth onto highway = 12*10 = 120 sec Time for last car to propagate from 1st to 2nd toll both: 100km/(100km/hr)= 1 hr A: 62 minutes 100 km 100 km ten-car caravan toll booth toll booth Caravan analogy Introduction
Cars now “propagate” at 1000 km/hr Toll booth now takes 1 min to service a car Q:Will cars arrive to 2nd booth before all cars serviced at 1st booth? Yes! After 7 min, 1st car at 2nd booth and 3 cars still at 1st booth. 1st bit of packet can arrive at 2nd router before packet is fully transmitted at 1st router! See Ethernet applet at AWL Web site 100 km 100 km ten-car caravan toll booth toll booth Caravan analogy (more) Introduction
Nodal delay • dproc = processing delay • typically a few microsecs or less • dqueue = queuing delay • depends on congestion • dtrans = transmission delay • = L/R, significant for low-speed links • dprop = propagation delay • a few microsecs to hundreds of msecs Introduction
R=link bandwidth (bps) L=packet length (bits) a=average packet arrival rate Queueing delay (revisited) traffic intensity = La/R • La/R ~ 0: average queueing delay small • La/R -> 1: delays become large • La/R > 1: more “work” arriving than can be serviced, average delay infinite! Introduction
“Real” Internet delays and routes • What do “real” Internet delay & loss look like? • Traceroute program: provides delay measurement from source to router along end-end Internet path towards destination. For all i: • sends three packets that will reach router i on path towards destination • router i will return packets to sender • sender times interval between transmission and reply. 3 probes 3 probes 3 probes Introduction
“Real” Internet delays and routes traceroute: gaia.cs.umass.edu to www.eurecom.fr Three delay measurements from gaia.cs.umass.edu to cs-gw.cs.umass.edu 1 cs-gw (128.119.240.254) 1 ms 1 ms 2 ms 2 border1-rt-fa5-1-0.gw.umass.edu (128.119.3.145) 1 ms 1 ms 2 ms 3 cht-vbns.gw.umass.edu (128.119.3.130) 6 ms 5 ms 5 ms 4 jn1-at1-0-0-19.wor.vbns.net (204.147.132.129) 16 ms 11 ms 13 ms 5 jn1-so7-0-0-0.wae.vbns.net (204.147.136.136) 21 ms 18 ms 18 ms 6 abilene-vbns.abilene.ucaid.edu (198.32.11.9) 22 ms 18 ms 22 ms 7 nycm-wash.abilene.ucaid.edu (198.32.8.46) 22 ms 22 ms 22 ms 8 62.40.103.253 (62.40.103.253) 104 ms 109 ms 106 ms 9 de2-1.de1.de.geant.net (62.40.96.129) 109 ms 102 ms 104 ms 10 de.fr1.fr.geant.net (62.40.96.50) 113 ms 121 ms 114 ms 11 renater-gw.fr1.fr.geant.net (62.40.103.54) 112 ms 114 ms 112 ms 12 nio-n2.cssi.renater.fr (193.51.206.13) 111 ms 114 ms 116 ms 13 nice.cssi.renater.fr (195.220.98.102) 123 ms 125 ms 124 ms 14 r3t2-nice.cssi.renater.fr (195.220.98.110) 126 ms 126 ms 124 ms 15 eurecom-valbonne.r3t2.ft.net (193.48.50.54) 135 ms 128 ms 133 ms 16 194.214.211.25 (194.214.211.25) 126 ms 128 ms 126 ms 17 * * * 18 * * * 19 fantasia.eurecom.fr (193.55.113.142) 132 ms 128 ms 136ms trans-oceanic link * means no response (probe lost, router not replying) Introduction
Packet loss • queue (aka buffer) preceding link in buffer has finite capacity • packet arriving to full queue dropped (aka lost) • lost packet may be retransmitted by previous node, by source end system, or not at all buffer (waiting area) packet being transmitted A B packet arriving to full bufferis lost Introduction
pipe that can carry fluid at rate Rsbits/sec) pipe that can carry fluid at rate Rcbits/sec) Throughput • throughput: rate (bits/time unit) at which bits transferred between sender/receiver • instantaneous: rate at given point in time • average: rate over long(er) period of time link capacity Rcbits/sec link capacity Rsbits/sec server, with file of F bits to send to client server sends bits (fluid) into pipe Introduction
Rs > RcWhat is average end-end throughput? Rsbits/sec Rcbits/sec Rcbits/sec bottleneck link link on end-end path that constrains end-end throughput Throughput (more) • Rs < RcWhat is average end-end throughput? Rsbits/sec Introduction
Throughput: Internet scenario • per-connection end-end throughput: min(Rc,Rs,R/10) • in practice: Rc or Rs is often bottleneck Rs Rs Rs R Rc Rc Rc 10 connections (fairly) share backbone bottleneck link Rbits/sec Introduction