Download
1 / 18
180 likes | 402 Views
The Little Ice Age Henrik Svensmark. Records. The Instrumental Record Tree Rings Marine, Lake, and Cave Proxies Ice Isotopes Glacier Length and Mass Balance Records Boreholes Documentary and Historical Evidence. Sources. Little Ice Age. Mideval Warm Period. Marine deposits. CORALS.

E N D
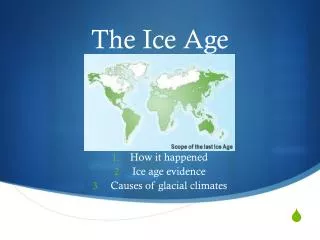
Records • The Instrumental Record • Tree Rings • Marine, Lake, and Cave Proxies • Ice Isotopes • Glacier Length and Mass Balance Records • Boreholes • Documentary and Historical Evidence
The Little Ice Age and Medieval Warming in South Africa Cave record • P. D. Tyson1, W. Karlén2, K. Holmgren2 and G. A. Heiss3. • 1Climatology Research Group, University of the Witwatersrand2Department of Physical Geography, Stockholm University3Geomar, Wischhofstr. 1-3, 24148 Kiel, Germany; present address: German Advisory Council on Global Change (WBGU), P.O. Box 120161, 27515 Bremerhaven, Germany, E-mail: g.heiss@gmx.de • Abstract • The Little Ice Age, from around 1300 to 1800, and medieval warming, from before 1000 to around 1300 in South Africa, are shown to be distinctive features of the regional climate of the last millennium. The proxy climate record has been constituted from oxygen and carbon isotope and colour density data obtained from a well-dated stalagmite derived from Cold Air Cave in the Makapansgat Valley. The climate of the interior of South Africa was around 1oC cooler in the Little Ice Age and may have been over 3°C higher than at present during the extremes of the medieval warm period. It was variable throughout the millennium, but considerably more so during the warming of the eleventh to thirteenth centuries.Extreme events in the record show distinct teleconnections with similar events in other parts of the world, in both the northern and southern hemispheres. The lowest temperature events recorded during the Little Ice Age in South Africa are shown to be coeval with the Maunder and Sporer Minima in solar irradiance. The medieval warming is shown to have been coincided with the cosmogenic 10Be and 14C isotopic maxima recorded in tree rings elsewhere in the world during the Medieval Maximum in solar radiation.
Famine and Dearth Scotland (Source: Lamb, 1995)
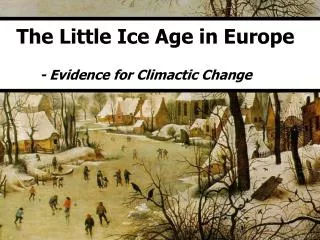
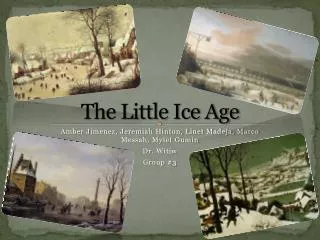
Science and Art • Neuberger (1970) studied more than 12,000 paintings in 41 art museums in the United States and eight European countries to test his hypothesis that paintings would accurately reveal the climate record. These paintings covered the period from 1400 to 1967. He categorized the blueness of the sky into a three-step scale consisting of pale blue, medium blue, and deep blue. Cloudiness was estimated according to the U.S. airways code: clear (less than 10 percent coverage), scattered (10 to 50 percent), broken (60 to 90 percent), and overcast (more than 90 percent cloud coverage.) In addition, the types of clouds were observed according to four families: high, middle, low, and convective (vertically-developed) clouds. Neuberger separated his data into three epochs. According to the data in Fig. 19 below, during the second epoch when the LIA was at its peak, cloudiness and darkness prevailed.