Download
1 / 30
300 likes | 311 Views
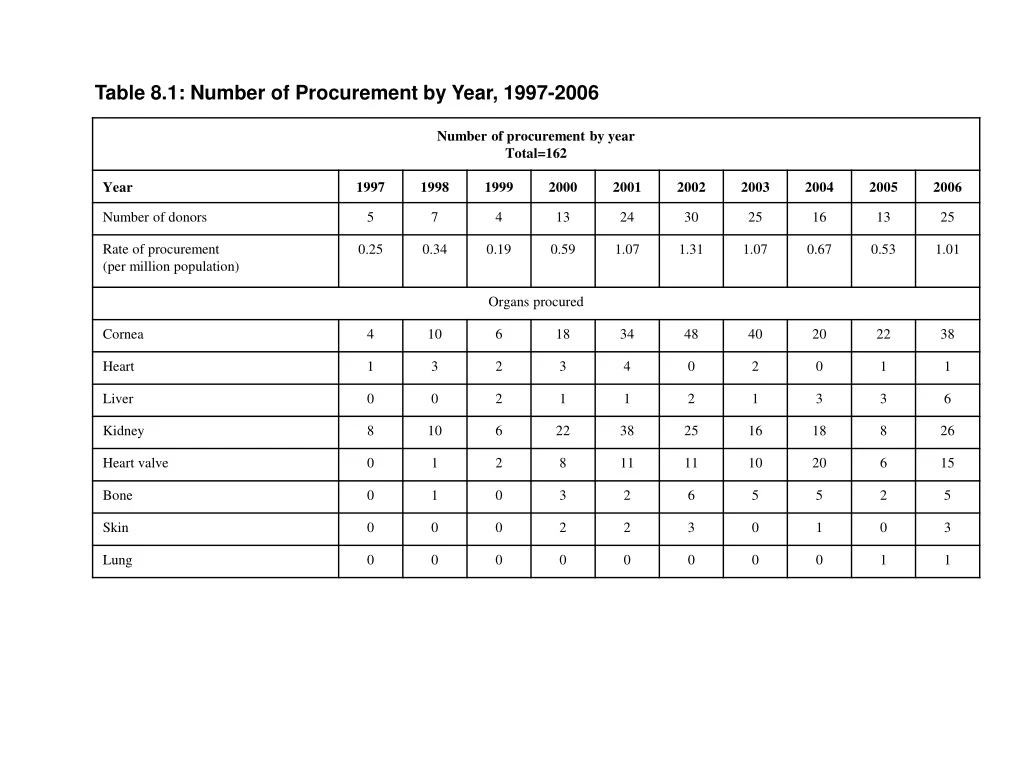
Table 8.1: Number of Procurement by Year, 1997-2006. 50. 40. 30. Number of patients (n). 20. 10. 0. 1998. 2000. 2002. 2004. 2006. 1997. 1999. 2001. 2003. 2005. Year. Figure 8.1: Number of Procurement by Year, 1997-2006. Table 8.2: Distribution of Donor’s Age, 1997-2006.

E N D
50 40 30 Number of patients (n) 20 10 0 1998 2000 2002 2004 2006 1997 1999 2001 2003 2005 Year Figure 8.1: Number of Procurement by Year, 1997-2006
Table 8.2: Distribution of Donor’s Age, 1997-2006 * The youngest tissue donor was 37 days old donated heart valves in 2003; the youngest organ donor was 2.5 years old donated kidneys and eyes in 2005. ** The oldest tissue donor was 81 years old donated eyes in 2005; the oldest organ donor was 65 years old donated kidneys in 2001.
Age 0-<10 years Age 10-<20 years Age 20-<30 years Age 30-<40 years Age 40-<50 years Age >=50 years 12 11 10 9 8 Number of patients (n) 7 6 5 4 3 2 1 0 1997 2001 1999 2003 2004 2005 1998 2000 2002 2006 Year Figure 8.2: Distribution of Donors by Age, 1997-2006
Donor's Age Group (years) in 2006 10 8 6 Number of patients (n) 4 2 0 0-<10 10-<20 20-<30 30-<40 40-<50 ≥50 Donor Age Group (years)
Male Female 50 40 Number of patients 30 20 10 0 1998 2000 2002 2004 2006 1997 1999 2001 2003 2005 Year Figure 8.3: Distribution of Donors by Gender, 1997-2006
Table 8.4: Distribution of Donors by Ethnic Group, 1997-2006
Malay Chinese Indian Others 20 15 Number of patients (n) 10 5 0 1998 2000 2002 2004 2006 1997 1999 2001 2003 2005 Year Figure 8.4: Distribution of Donors by Ethnic Group, 1997-2006
Islam Buddhism Hinduism Christianity Others Unknown 100 90 80 70 60 Proportion of patients (%) 50 40 30 20 10 0 1998 2000 2002 2004 2006 1997 1999 2001 2003 2005 Year Figure 8.5: Distribution of Donors by Religion, 1997-2006
Malaysian Non-Malaysian 100 90 80 70 60 Proportion of patients (%) 50 40 30 20 10 0 1997 1999 2001 2003 2005 1998 2000 2002 2004 2006 Year Figure 8.6: Distribution of Donors by Nationality, 1997-2006
Table 8.7: Distribution of Donors by State of Residence, 1997-2006 *State of residence according to home address ** Others constitute donors who were foreigners, one from Yangon Myanmar in 2003 and another from Taiwan in 2006
Pledged Non-Pledged 100 90 80 70 60 Proportion of patients (%) 50 40 30 20 10 0 1998 2000 2002 2004 2006 1997 1999 2001 2003 2005 Year Figure 8.8: Donor’s Pledged Status, 1997-2006
Table 8.9: Distribution of Donors by Type, 1997-2006 *DCD involve tissue donation only
BD DCD 100 90 80 70 60 Proportion of patients (%) 50 40 30 20 10 0 2003 1998 2000 2002 2004 2006 1997 1999 2001 2005 Year Figure 8.9: Distribution of Donors by Type, 1997-2006
Table 8.10: Distribution of Donors by Cause of death, 1997-2006
Table 8.11: Distribution of Organ Donors by Blood Group, 1997-2006 Blood group is only ascertained in brain dead donors and is not done for tissue donors post -cardiac deaths
A+ B+ AB+ O+ 12 11 10 9 8 7 Number of patients (n) 6 5 4 3 2 1 0 1997 1999 2001 2003 2005 1998 2000 2002 2004 2006 Year Figure 8.11: Distribution of Organ Donors by Blood Group, 1997-2006
Distribution of Organ Donors by Blood Group 1997-2006 Unknown 3% A+ 23% O+ 41 % B+ 28% AB+ 5%
Distribution of Organ Donors by Blood Group 2006 0+ A+ 21% 29% AB+ 14% B+ 36%
Table 8.12a: Distribution of Donors by Institution of Origin, 1997-2006
MOH state/G. Hospitals MOH district hospitals University hospitals Private hospitals Home 100 90 80 70 60 Proportion of patients (%) 50 40 30 20 10 0 1997 1999 2001 2003 2005 1998 2000 2002 2004 2006 Year Figure 8.12a: Distribution of Donors by Institution of Origin, 1997-2006
Table 8.12b: Distribution of Donors by Referral Site, 1997-2006
ICU Ward Emergency department Mortuary Home Not available 100 90 80 70 60 Proportion of patients (%) 50 40 30 20 10 0 1997 1999 2001 2003 2005 1998 2000 2002 2004 2006 Year Figure 8.12b: Distribution of Donors by Referral Site, 1997-2006
Table 8.12c: Distribution of Donors by Procurement Site, 1997-2006
Operation theatre Mortuary Ward Home Not available 100 90 80 70 60 50 Proportion of patients (%) 40 30 20 10 0 1997 1999 2001 2003 2005 1998 2000 2002 2004 2006 Year Figure 8.12c: Distribution of Donors by Procurement Site, 1997-2006