Download
1 / 25
260 likes | 268 Views
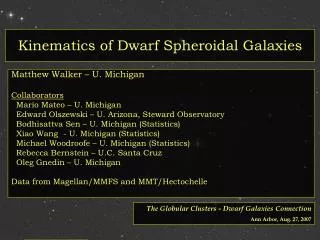
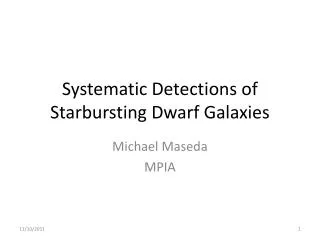
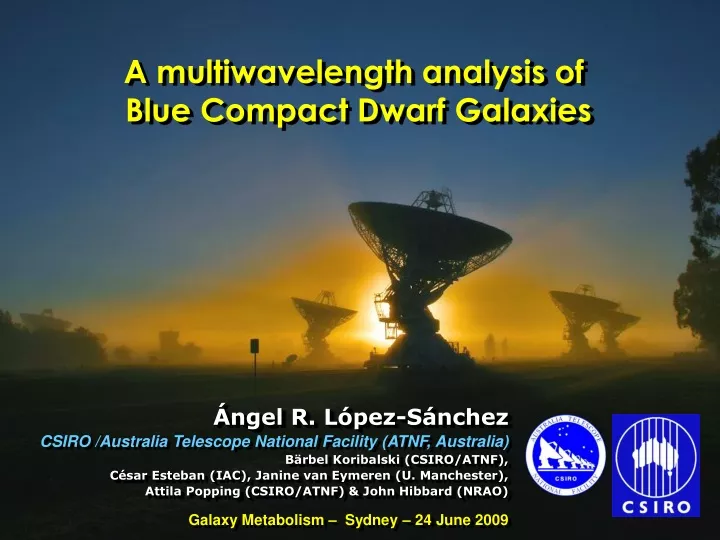
The Local Volume HI Survey. A multiwavelength analysis of Blue Compact Dwarf Galaxies. Ángel R. López-Sánchez CSIRO /Australia Telescope National Facility (ATNF, Australia) Bärbel Koribalski (CSIRO/ATNF), César Esteban (IAC), Janine van Eymeren (U. Manchester),

E N D
The Local Volume HI Survey A multiwavelength analysis of Blue Compact Dwarf Galaxies Ángel R. López-Sánchez CSIRO /Australia Telescope National Facility (ATNF, Australia) Bärbel Koribalski (CSIRO/ATNF), César Esteban (IAC), Janine van Eymeren (U. Manchester), Attila Popping (CSIRO/ATNF) & John Hibbard (NRAO) Galaxy Metabolism – Sydney – 24 June 2009
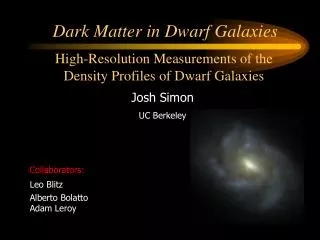
Blue Compact Dwarf Galaxies (BCDGs) • Subset of low-luminosity (MB -18) and low metallicity (~10 % solar) galaxies undergoing a strong and short-lived episode of star formation. • Quickly gas consumption • unlike spirals, star formation occurs in transient, sporadic bursts. • Compact, irregular morphologies • Intense narrow emission lines superposed on a blue continuum (i.e. Thuan 1991). • Sometimes, Wolf-Rayet features! • The starbust and a very young stellar population dominate the optical light (Cairós et al. 2001), very often masking all evidence of the underlying older stellar population, • NIR photometry is sometimes needed to separate both components (Noeske et al. 2003). • However, the origin and peculiar nature of their starburts is still poorly understood. IC 4662 (EMMI @ NTT, B + R + Ha) SBS 1054+365 (ALFOSC @ NOT, U + B + V)
Massive star formation in Wolf-Rayet galaxies Á.R. López-Sánchez PhD Thesis (2006) supervised by C. Esteban (IAC) See López-Sánchez & Esteban, 2008, paper I (A&A 491, 131) and II (2009, in rev.) and III (2009, in prep.). We completed a detailed analysis of a sample of 20 Wolf-Rayet galaxies (many of them BCDGs) combining deep optical and NIR broad band and H imaging together with optical spectroscopy (long slit and echelle) data + UV, HI, FIR from literature. Our multiwavelength analysis revealed that the majority of studied objects(16 up to 20) shows features such as plumes, tails, TDGs, regions with very different chemical abundances inside galaxies, perturbed kinematics of the ionized gas or lack of neutral hydrogen gas, suggesting that interactions have played an important role in the triggering mechanism of the observed star-formation bursts.
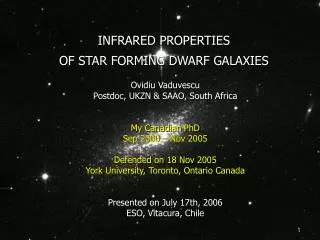
NGC 2915 – HI (blue) + B (green) + R (red) Meurer et al. 1996 II Zw 40 - B + HI contours van Zee et al 1998 Interferometric H I observations of BCDGs H I observations of BCDGs: • Single-dish HI surveys(i.e. Thuan et al. 1999; HIPASS, Koribalski et al. 2004; Huchtmeier et al. 2005; 2007) • Still not many high-resolution HI studies! And giving unexpected surprises. Importance of interf. HI observations: • H I morphology andestimation of neutral gas mass globally and locally (clumps), • Analysis of the H I kinematics (rotation or turbulence behaviour, total mass, dark matter), • Neutral hydrogen gas is the best tracer for galaxy-galaxy interactions !!! Combining H I results with other parameters (absolute luminosity, SFR, stellar and dust content, oxygen abundance...) provide powerful clues about the nature and evolution of BCDGs.
Observations of BCDGs using the ATCA • POX 4 • He 2-10 • IC 4662* • IC 4870 • Tol 1924-416 • ESO 108-G017 • Tol 9 • Tol 30 • Australia Telescope Compact Array, 6 x 22m dishes, Narrabri, NSW, Australia • Deep H I line & 20 cm radio continuum observations for a sample of BCDGs • NGC 1510* • NGC 5253* • Full12h x 4arrays: EW 367m, 750m, 1.5km, 6 km • Velocity resolution of 4 km/s • HI column density: • ~ 5 x 1019 cm-2 (for 40” beam) • Angular resolution of ~20” • Observations were completed on Feb 2009 • * Belonging to the Local Volume HI Survey (LVHIS) project, PI B. Koribalski
8.8’ The galaxy NGC 5253 • DHel= 4.0 Mpc (Karachentsev et al. 2004) • Scale: 19 pc / arcsec • Optical size: 5.0’ 1.9’ • Classified as Im pec, H II starburst (NED), BCDG • One of the closest starbursts, observed at all wavelengths • It belongs to the M83 subgroup of the Centaurus Group • Deep analysis of its ionized gas using UVES@VLT López-Sánchez et al. 2007 NGC 5253 – B (blue) + V (green) + I (red) 2.5m du Pont telescope, Las Campanas Observatory, combined by Á.R. López-Sánchez NGC 5253 – V (blue) + I (green) + H (red) 2.5m du Pont telescope, LCO (V, I) + 1.5m CTIO (H) combined by Á.R. López-Sánchez
12+log O/H = 8.18 log N/O = – 0.91 12+log O/H = 8.28 log N/O = – 1.50 NGC 5253: Deep VLT echelle spectroscopy • 4 independent regions analized in detail: • Physical conditions: Ne, Te, reddening. • Chemical abundances: O, N, Ne, S, Cl, Ar, Fe, He, C • Kinematics of the ionized gas • 169 emission lines identified in region B 2 main results: • The confirmation of a localized chemical pollution, • The detection of O and C recombination lines. López-Sánchez, Esteban, García-Rojas, Peimbert & Rodríguez 2007, ApJ 656, 168 and López-Sánchez PhD Thesis NGC 5253 – WFPC @ HST UV (blue) + H (green) + [S II] (red) Combined by Á.R. López-Sánchez
NGC 5253: H I radio data New radio data of NGC 5253 from the LVHIS (Local Volume HI Survey) project using four different ATCA arrays Properties: • H I flux: 31.1 1.5 Jy km/s • H I mass: (8.0 0.4) 107 M • Dynamical mass: ~108 M López-Sánchez, Koribalski & Esteban 2007 NGC 5253 – H I map (blue) + R (green) + H (red)
NGC 5253: H I radio data ESO 154-G023 ATCA H I velocity field H I velocity field: Rotating about the optical MAJOR axis? • Any kind of outflow? • Formation of a polar ring? • Interaction with M83 ~1 Gyr ago? • Disruption/accretion of a gas-rich companion Kinematics of the ionized gas decopled from kinematics of stars? H I velocity field: Rotating about the optical MAJOR axis? • López-Sánchez, Koribalski & Esteban 2007 and Kobulnicky & Skillman 2008 NGC 5253 ATCA H I velocity field
WR galaxy Tol 9 within the Klemola 13 group • Klemola 13 group (HIPASS J1034-28) • Located at 43.3 Mpc • Tol 9 (ESO 436-42) is a starburtWR galaxy • ESO 436-46 is a spiral at 20 kpc from Tol 9. • Several objects surrounding Tol 9. • 2 slit positions using 2.5m INT & 2.56m NOT. • Chemical abundances using direct method: • 12+log O/H = 8.57±0.10 • log N/O = – 0.81 ± 0.11 López-Sánchez & Esteban (2008, 2009)
Deep V image, ALFOSC @ 2.56m NOTLópez-Sánchez (2006) López-Sánchez & Esteban (2008) WR galaxy Tol 9 within the Klemola 13 group • Our new deep images reveal a bridge towards a dwarf companion object at 10 kpc. • Composed by an OLD pop.
WR galaxy Tol 9 within the Klemola 13 group • Our new deep images reveal a bridge towards a dwarf companion object at 10 kpc. • Composed by an OLD pop. • H image reveals on-going star formation activity and a filamentary structure. Continuum-substractedH image, ALFOSC @ 2.56m NOTLópez-Sánchez (2006) López-Sánchez & Esteban (2008)
Tol 9 and surroundings López-Sánchez & Esteban (2008)
WR galaxy Tol 9 within the Klemola 13 group • The kinematics of the ionized gas was studied via the analysis of emission line profiles of our spectra. Tol 9 • PA 49º:Strange velocity pattern that can not be attributed to rotation. • PA 109º:It crosses the filamentary H structure, showing a very intriguing behaviour: • a bipolar bubble expanding at about 80 km s-1? PA 49º PA 109º López-Sánchez & Esteban (2009)
WR galaxy Tol 9 within the Klemola 13 group • HIPASS reveals a considerable amount of atomic gas, probably mostly associated with ESO 436-46. • We obtained ATCA H I ob-servations in 6 km, 1.5 km, 750m and 350m arrays • Also cont. observations at 20, 13, 6 and 3 cm.
78” x 32” WR galaxy Tol 9 within the Klemola 13 group H I distribution • Total HI mass: • MHI: 3.1 109 M • Tol 9 cloud: • MHI: 2.2 109 M • MHI/LB = 0.21 • MDyn/LB = 18.8 • ESO 436-46: • MHI: 8.7 108 M • MHI/LB = 0.07 • MDyn/LB = 10.4 • Tail: • MHI: 6.0 107 M • H1032-2819: • MHI: 3.5 107 M Tail ESO 436-46 Tol 9 H 1032-2819 López-Sánchez et al. In prep.
78” x 32” WR galaxy Tol 9 within the Klemola 13 group H I kinematics • ESO 436-46: • MDyn: 1.7 1011 M • MDyn/LB = 10.4 • Tol 9 cloud: • Disturbed kin. at E • MDyn: 2.0 1011 M • MDyn/LB = 18.8 • Tail: - – Cte velocity PA 192º Tail ESO 436-46 PA 273º Tol 9 H 1032-2819 López-Sánchez et al. In prep.
WR galaxy Tol 30 • D= 29.3 Mpc • 1’ = 8.5 kpc • Optical size: 1.2’ 1’ • Two intensestar-forming regions in opposite places within the galaxy • Optical imagery and ionized gas analysis using 2.56m NOT: • WR features • 12+log O/H = 8.07 • log N/O = – 1.5 • Deep optical imagery using WFC @ 2.5m INT • Detection of nearby and diffuse non-stellar objects Tol 30 – B (blue) + R (green) + H (red) ALFOSC @ 2.6m NOT Tol 30 – B (blue) + V (green) + R (red) WFC @ 2.5m INT Tol 30 – H I map (blue) + B (green) + R (red) López-Sánchez et al. In prep.
Tol 30 dwarf – B (blue) + R (green) + Ha (red) 1 frame 150s per filter, not reduced Observations at 2.3m ANU 2 nights ago! WR galaxy Tol 30 ? H I distribution • Total HI mass: • MHI: 1.4 109 M • Tol 30 MB: • MHI: 1.1 109 M • MHI/LB = 1.2 • MDyn/LB = 17.1 • Northern tail: • MHI: 2.1 108 M • 15% total HI mass • Eastern tail: • MHI: 9.1 107 M • 7% total HI mass • TDG or dwarf obj?: • MHI: 2.3 107 M • MHI/LB = 0.12 • It shows rotation! • MDyn/LB = 7.3 Northern tail Tol 30 Eastern tail Tol 30 – H I map (blue) + B (green) + R (red) López-Sánchez et al. In prep.
The galaxy pair NGC 1512 / 1510 • NGC 1512: • SB(r)ab, Z ~0.7 Zo • D = 9.5 Mpc • Bar ~ 3’ = 8.3 kpc • Ring ~ 3’ x 2’ = 8.3 x 5.5 kpc • Nuclear ring ~ 16” x 12” (740 x 550 pc) • NGC 1512: • SB(r)ab, Z ~0.7 Zo • D = 9.5 Mpc • Bar ~ 3’ = 8.3 kpc • Ring ~ 3’ x 2’ = 8.3 x 5.5 kpc • Nuclear ring ~ 16” x 12” (740 x 550 pc) • NGC 1510: • S0, BCD, WR, Z~0.2 Zo • Probable N enrichment • 5’ = 13.8 kpc from NGC 1512 • H images (Meurer et al. 2006) reveal many star forming regions • Sizes 2”–5” (90–230 pc) • Dozens in the ring • NGC 1510 • But also in external regions with no evident continuum emission!
H I in NGC 1512 / 1510 • ATCA observ. using 7arrays • Mosaicusing 4 pointings • Total int. time:3.11 days • Huge amount of neutral gas! • Two extended spiral arms • Two TDG candidates • NGC 1512: • NGC 1510: TDG NGC 1512 NGC 1510 • MHI = 5.7109 M • MDyn~ 4 x 10¹¹ M • MHI/LB = 1 • MHI ~ 4x10⁷ M • MHI/LB ~0.07 TDG • Koribalski & López-Sánchez (2009, MNRAS)
H I / UV comparison in NGC 1512/1510 • Koribalski & López-Sánchez (2009, MNRAS, in rev.)
NGC 1512 / 1510 Rotation fit and residues • The velocity field is mainly rotation, • But we found some discrepances in the most external regions and in the position of NGC 1510. • Star formation activity and the external HI structures seem to be consequence of the interaction that NGC 1512 and NGC 1510 are experiencing. Minor merger ~ 400 Myr Koribalski & López-Sánchez 2009, MNRAS NGC 1512 / 1510 also include in the THING project, with higher spatial resolution (Deane & de Blok, in prep)
Further tidal tails features in BCDGs • IC 4870 • D = 10.2 Mpc • Optical prop: • 35” compact core, • Elliptical low-luminosity component 1.4’x0.4’ • H I reveals two long tails 3.7’ (N) and 4.2’(S) • Knot in S tail has ~14% of the neutral mass. • Merger of two independent HI clouds? • ESO 108-G017 • D = 28.2 Mpc • Faint optical tail • HI is +5 times optical size! • Elongated HI cloud with some disturbed kinematics • He 2-10:Extended HI emission perpendicular to rotation axis? • POX 4:Independent HI cloud + strange HI kinematics?
Conclusions • Detailed multiwavelength analysis of BCDGs • Optical / NIR imagery • H imagery • Deep optical spectroscopy (long slit and echelle) • H I and 20cm observations • H Idata are fundamental to understand thedynamical evolutionof these objects. • Despite the environment, ALL studied BCDGs show interactions features, very evident in the majority of them, confirming the main result found in our analysis of a sample of Wolf-Rayet galaxies (López-Sánchez PhD, 2006; López-Sánchez & Esteban 2008, 2009a,b) • Are interactions between dwarf objects the main triggering mechanism of starbursts, specially in BCDGs? • Many surprises will come from HI surveys, i.e. using ASKAP,Australia SKA Pathfinder!!