Download
1 / 27
270 likes | 275 Views
This presentation explores various satellite-based remote sensing methods to estimate evapotranspiration (ET) from irrigated land in the Smith River Basin of Montana. The study evaluates different methods of ET estimation and their accuracy based on irrigation type. The results of the analysis will provide insights into water consumption and inform effective water management strategies.

E N D
Comparison of Satellite-Based, Remote Sensing Methods for Estimating Evapotranspiration from Irrigated Land in the Smith River Basin of Montana October 19, 2018 Montana AWRA 2018 Conference West Yellowstone, Montana Chuck Dalby, Hydrologist, Water Resources Division, DNRC (alm.retd) Troy Blandford, Remote Sensing Analyst, Montana State Library Bill Greiman, Agricultural Engineer, Water Resources Division, DNRC (retd.) Gerry Daumiller, GIS Analyst/Programmer, Montana State Library (retd.)
Presentation Overview • 1. Why do we care about Evapotranspiration (ET) ? • 2. How is ET estimated ? • Ag Engineering Equations • Satellite-based, Surface-Energy Balance Methods • 3. Evaluation of ET estimates by Method and Type of Irrigation • --Statistical Design • 4. Results • --Factorial ANOVA • --Is there a difference in water consumption between flood and • center pivot irrigation ? • -- How do estimates of ET vary by method of ET estimation
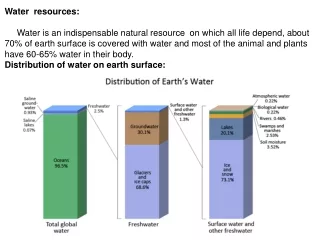
1. Why do we care about ET ? ET is typically 10 to 50 (or > ) % of annual water budget
Why is ET from irrigated land important ? ~2.5 million acres ±500,00 acres of irrigated agriculture in Montana >90% of total water diverted for use, is diverted for irrigation; of the total water consumed >90% is consumed by irrigation. Accurate information on ET is essential for good water management, (hydrologic modeling, water planning, water rights administration). NRCS Photo
2. How is ET calculated ? Blaney-Criddle (1962) (empirical temperature based) Et = kc × ∑ F (1) = (T × p) / 100 (2) Where kc=empirical crop coefficient F=monthly consumptive use T= mean-monthly temperature p=monthly percent of daytime hours ASCE Penman-Monteith Reference ET (2005) (process-based surface energy balance)
Surface- Energy Balance Methods Surface -Energy Balance Methods rely on Conservation of Energy to calculate energy balance in boundary layer, and ET as residual of energy balance ≈ boundary layer over field (~2 to 3m for alfalfa)
Seasonal (April-October) Remote Sensing ET Estimates: Smith River Basin -- 2007 NRIS-DNRC Automated Method (vegetation index with thermal band adjustment)
Evaluation of ET estimates by Method and Type of Irrigation Statistical Design Map and classify Smith River irrigated land; 2. Extract spatially independent, random sample of 2007 irrigated polygons, stratified by type of irrigation-- wild flood (WF), flood (F), sprinkler (S), sprinkler pivot (SP); Implement Factorial 3x4 ANOVA with 2 factors, Method of ET Estimate with 3 levels and Irrigation Type with 4 levels; Use Generalized Linear and Mixed Models (for balanced samples) to compare ET means by irrigation type and method of ET estimation: Method of ET Estimate: : METRIC SSEB NRIS/DNRC Irrigation Type : (WF,F,S,SP)
Southern Smith River Study Area and Irrigated Acreage White Sulphur Springs
Method for Mapping 2007 Smith River Irrigation In a GIS, overlay the FLU 2017 mapping on the NAIP orthoimagery; Inspect agreement between the NAIP imagery and FLU 2017 mapping. If necessary, edit the FLU coverage ; Classify the irrigated parcels by irrigation type based on interpretation of NAIP imagery: Irrigation Classes: 1. Sprinkler-Pivot (SP) 2. Sprinkler-All other systems (S) 3. Flood (F) 4. Wild Flood/Subirrigated (WF)
Golf course with April-Oct 2007 METRIC Total ET grid superimposed 30m pixel
Size of irrigated parcels in Smith River study area Flood, Wild Flood, Sprinkler irrigated parcels similar in size Sprinkler-pivot parcels much larger with some nearly 1 mile in diameter
Estimation of what was irrigated in 2007 ? Delineate 15 parcels in the not irrigated in 2007— upland, dryland sites not influenced by groundwater; 2. Extract total seasonal METRIC ET grid values for not irrigated parcels: median value ET =11.1 in Parcels with seasonal ET values > 11.1 in defined as irrigated; remainder removed prior to sampling
SP-MMEAN SP-SMEAN SP-NMEAN
Extract spatially independent random samples, stratified by irrigation type Problem-- need spatially independent random sample to meet assumptions of statistical tests (avoid “pseudo replication” due to autocorrelation): but--irrigation polygons naturally cluster around points of diversion, along riparian corridors, farm boundaries Solution-- use POLS (Polygon Sampling Tool-- random sampling tool with spatial balance: --iterative process: extract sample, test for spatial independence using Moran’s I
Extract spatially independent, balanced, random sample of 2007 irrigated polygons, stratified by type of irrigation-- wild flood (WF), flood (F), sprinkler (S), sprinkler pivot (SP);
Smith South POLS Random Sample POLS random sample All parcels ET >11.1 inches
4. Results: ANOVA Implement Factorial 3x4 ANOVA with 2 factors (Irrigation Type and Method of ET Estimate) using Generalized Linear and Mixed Models (SAS) (for balanced samples) to compare ET means by irrigation type and method of ET estimation): Method of ET Estimate: : METRIC SSEB NRIS/DNRC Irrigation Type : (WF,F,S,SP) Use ANOVA to test 3 hypotheses: H0 : There is no difference in the mean ET of WF,F,S, and SP irrigated parcels; H1 : At least one mean differs; H0 : There is no difference in the mean ET of WF,F,S, and SP irrigated parcels estimated by the three methods; H1 : At least one mean differs; H0 : There is no interaction between the type of irrigation and the three methods of ET estimation; H1 : At least one factor shows interaction.
Results: Mixed-Model ANOVA At least 1 value differs from group mean No interaction
Results “clearly” show that many differences in ET values by Method and Irrigation Type are not significant
Results show no significant difference between METRIC And SSEB estimates across all methods of irrigation Flood: METRIC:SSEB no.sig. diff NRIS/DNRC sig. less Sprinkler: METRIC:SSEB no.sig. diff NRIS/DNRC sig. less Sprinkler-Pivot: METRIC:SSEB no.sig. diff NRIS/DNRC sig. less Wild Flood: METRIC:SSEB no.sig. diff NRIS/DNRC sig. less
Results show no significant difference between flood, wild flood and sprinkler ET values across all methods of irrigation F WF SP S METRIC SSEB NRIS/DNRC Method * ITYPE
CONCLUSIONS Basin-wide, total seasonal ET estimates developed using SSEB were about 10% less than METRIC and the NRIS/DNRC estimate was about 30% less; However ANOVA results show no significant difference between METRIC and SSEB estimates across all types of irrigation; NRIS/DNRC is significantly less; Results also show no significant difference between flood, wild flood and sprinkler ET values across all methods ET estimation; sprinkler pivot ET is larger Smith River courtesy of Dave Amman