Download

1 / 48
480 likes | 674 Views
A Survey of Testability Measurements at Various Abstraction Levels. Naghmeh Karimi+ Pedram Riahi* Zainalabedin Navabi+ Electrical and Computer Engineering +University of Tehran *Northeastern University. Outline. Introduction Testability Analysis Gate Level Testability Analysis

E N D
A Survey of Testability Measurements at Various Abstraction Levels Naghmeh Karimi+ Pedram Riahi* Zainalabedin Navabi+ Electrical and Computer Engineering +University of Tehran *Northeastern University
Outline • Introduction • Testability Analysis • Gate Level Testability Analysis • RT Level Testability Analysis • Behavioral Testability Analysis • Conclusion
Outline • Introduction • Testability Analysis • Gate Level Testability Analysis • RT Level Testability Analysis • Behavioral Testability Analysis • Conclusion
Outline • Introduction • Testability Analysis • Gate Level Testability Analysis • RT Level Testability Analysis • Behavioral Testability Analysis • Conclusion
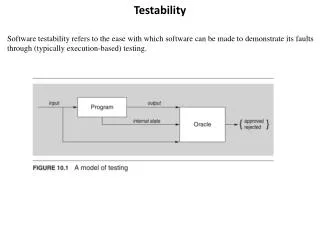
Testability Analysis • Testability is an intrinsic property of a circuit. • Testability analysis is a way of showing how easy or how hard it is to test a circuit. • The Testability metrics are related to the fault coverage of a design and they are used to measure the fault sensitization and fault propagation cost during test generation.
Outline • Introduction • Testability Analysis • Gate Level Testability Analysis • RT Level Testability Analysis • Behavioral Testability Analysis • Conclusion
Gate Level Testability Analysis • Gate level testability is measured using a netlist of the circuit being analyzed. • Some traditional approaches consider the distance of a line from the primary inputs or the primary outputs as the testability metrics of that line a design .
Gate Level Testability Analysis Methods • Generic Methods • SCOAP • TMEAS • CAMELOT • COP • LEVEL • VICTOR • TESTSCREEN
Generic Methods • Some Gate Level Testability Techniques are based on measuring 0-controlability, 1-controllability and observability parameters .
c ( ) : l 0 0-controllability of line l 2 å å = TST k ( C ( l )) c ( ) : l 1-controllability of line l i i 1 i = 0 Î l L c ( ) : l Observability of line l 2 Generic Methods (Cont.) TST : the Circuit Testability Ki : the weight assigned to the controllability and observability values.
SCOAP(Sandia Controllability Observability Analysis Program) • The Testability measurement is based on the controllability and the Observability of the nodes. • The measures reflect the difficulty of controlling and observing the nodes. • Controllability metrics : • Combinational controllability • Sequential controllability
SCOAP(Controllability) • The combinational controllability provides an estimate of the distance to PIs. • The sequential controllability provides an estimate of the number time frame needed to provide a 0 or 1 at a particular output.
EXAMPLE(XOR GATE) CC0(Y) = min {CC0(A) + CC0(B) , CC1(A) + CC1(B)} + 1 CC1(Y) = min {CC0(A) + CC1(B) , CC1(A) + CC0(B)} + 1 SC0(Y) = min {SC0(A) + SC0(B) , SC1(A) + SC1(B)} SC1(Y) = min {SC0(A) + SC1(B) , SC1(A) + SC0(B)}
SCOAP (Cont.) Some methods are basically the same as SCOAP but with different improvements: • COMET • ITTAP • ARCOP • DTA • FUNTAP
TMEAS • The Testability measurement is based on the Controllability and the Observability of the nodes. • The measures are between 0 and 1 to reflect the ease of the controlling and observing the the nodes.
xi : Input 1<=i<=n : Output 1<=j<=m zj n 1 å = × CY ( z ) CTF CY ( x ) j i n = i 1 - N ( 0 ) N ( 1 ) m 1 å j j = - CTF ( 1 ) n m 2 = j 1 TMEAS(controllability) Nj (k) : The number of input combinations for which zj has value k
m 1 å = × OY ( x ) OTF OY ( z ) i j m = 1 j n 1 NS å = i OTF n n 2 = i 1 TMEAS (Observability) NS i: The number of input combinations for which the change of xi results in a change of output
CAMELOT • The Testability measurement is based on the controllability and the Observability of the nodes. • The measures are between 0 and 1 to reflect the ease of the controlling and observing the the nodes.
= CY ( output ) CTF f (( CY ( inputs )) s - N ( 0 ) N ( 1 ) = - 1 CTF + N ( 0 ) N ( 1 ) CAMELOT (Controllability) N (k) : The number of input combinations for which output has value k CTF : Control Transfer Factor
Outline • Introduction • Testability Analysis • Gate Level Testability Analysis • RT Level Testability Analysis • Behavioral Testability Analysis • Conclusion
RT Level Testability Analysis Methods • Generic Method • Probability Based Method • Pattern Based Method • Data Flow approach • BDD Based Method • Discrete Mathematics Approach
General Approach • At the RT level, a common approach to testability analysis is based on the probabilities of data. • Some of the existing algorithms propose measuring the combinational and sequential controlling and observing of the individual lines of a design.
Probability Based Method Testability Parameters: • Controllability (Randomness) • Observability (Transparency)
Randomness • Based on State probability distribution. • Ranges from 0 and 1. • Provides the ease of controlling a register.
2 | x |-1 I 1 1 å = = x MR ( x ) P log x , i 2 x x P = i 0 x , i Randomness Px,i: probability that Register X is in state i Px: state probability distribution |x|:bit width of the Register x Ix: Entropy
Transparency • Based on State probability distribution. • Ranges from 0 and 1. • Provides the ease of observing a register.
P : Probability Distribution Vector P x x : State-Based Transparency Vector t x Transparency • State Error occurs at Register x if under Fault-free conditions, the register has state i, but in the presence of some faults, register has another state i1, where i # i1. r r = MT t . ( x ) x MT(x) :Probability that an arbitrary state-error in Register x can be propagated to an observable point.
é ù é ù ´ ´ 1 1 1 1 - - 2 1 2 1 å å Ä = t S . P t . P ê ú ê ú Ä , , , , x i ij y j z i j y j ë û ë û = = 0 0 j j Register x Register y tx,i: Transparency of Register x, given that the Fault-free state of Register x is i. CLB : Sensitivity Matrix of CLB. S Register z Transparency Si , j : probability that a state error at the left hand of the CLB From i to i1 will cause a cause a state error in the output of the CLB, given that the right hand input of the CLB has value j.
Pattern Based Method • The controllability of Register x (C(x)) depends on the number of the patterns that can be set on this register. • The observability of Register x (O(x)) is computed from the number of different pattern pairs for which switching from one to the other has a different effect on the circuit output.
y = 1 C ( X ) n 2 y = 2 O ( X ) - * - 1 n n ( 2 ( 2 1 )) Pattern Based Method • C(N) : Controllability of Register X • O(N): Observability of Register X • n: Size of Register X • y1: All possible patterns that can be generated on X • y2: All different pairs that have different effects on output
Data Flow approach • The testability of a circuit is evaluated by sufficiency and smoothness of dataflow. • Sufficiency is measured by the amount of data . • Smoothness is evaluated by the implication cost to activate the dataflow
Controllability Controllability of a register depends on : • Control Data Amount • Control Implication Data Amount • Control Step Count
Controllability metrics • Data Amount of a word is the number of bits required to express the values it can take. • Control data amount is the estimated number of patterns that the output word of a register or operation can take as its value. • Control implication data amount is the sum of the word length of registers that control this register. • Control step count is the ratio of control implication data amount to the sum of word length of primary inputs, which are used to feed the control implication data amount.
Observability The observability of a register depends on : • Observation Data Amount • Observation Implication Data Amount • Observation Step Count • Observation Path Activation Ratio
Observability Metrics: • Observation data amount is the minimum word length of the observation path through which the value of output word can be propagated to an output. • Observation implication data amount is the sum of word length of registers whose values need to be determined to observe the output word of this register in an observable point. • Observation step count is the ratio of the observation implication data amount to the sum of word lengths of the primary inputs that are used to feed the observation implication data amount. • Observation path activation ratio is the ratio of the data amount of an input of the observation path to the corresponding parameter at the outputs of the observation path (primary outputs).
ones _ count = C ( l ) 1 N Simulation Based Method • Using simulation information to compute the controllability and observability of the individual lines of a design. • C1(l) :One-Controllability of a module external Line l • N : Number of test vectors • ones_count : Number of times a 1 appears on Line l after applying N test vector
BDD Based Method • The testability of a design is related to the number of the test vectors required to test the design. • Variable Testability Measure (VTM) of Line x : the minimum number of test vectors required to test the function represented by this line. • The sum of the VTMs at the primary outputs presents the testability of the entire circuit.
Discrete Mathematics Approach • The circuit elements are classified into sets according to their function in the design and their role during the test application. • This method is based on ipaths. • by considering the ipaths the controllable and the observable registers of the design are determined.
Outline • Introduction • Testability Analysis • Gate Level Testability Analysis • RT Level Testability Analysis • Behavioral Testability Analysis • Conclusion
Behavioral Level Testability Analysis Methods • Probability Based Method • Controllability Based Method • Variable Range Based Method
Probability Based Method • Using Randomness and Transparency metrics to measure the controllability and observability of signals embedded within a behavior.
Controllability Based • Variables are classified into 2 groups: • Completely Controllable (CC) • Non-Completely Controllable (NCC) • Classification is done based on the sensitivity analysis.
Variable Range Based Methods • Including Statement Reachability • Including Statement Hardness
Including Statement Reachability • Testability Parameters: • Variable Range • Operation Testability • Statement Reachability
Including Statement Reachability (Cont.) • If a line of code puts a limit on the Value Range of a variable, testing the corresponding hardware becomes more difficult. • The Operation Testability reflects the change in distribution of test vectors in the output of an operation assuming all possible test vectors on its inputs. • The third parameter is Statement Reachability Because Some testing problems of a design are due to unreachability of its statements in the control flow.
Including Statement Hardness • Testability Parameters: • Variable Range • Statement Hardness
Including Statement Hardness (Cont.) • Statement Hardness is defined for every line of a behavioral code. • It depends on the number of the code lines that a given line of code controls and on the specific instruction contained in a line of code.
Conclusion • Gate level analysis methods are accurate but time consuming. • RT level testability methods are generally based on the gate level methods, but they are vector based. • RT level testability is less accurate than that at the gate level. • Behavioral testability measure methods are based on lines of code and behavioral variables. • Performing testability analysis at the Behavioral level is less accurate than the RT level because at this level allocation of the structural components has not been determined yet.