Download
1 / 18
190 likes | 287 Views
2012 -2014 Street Rehabilitation City of Thornton Infrastructure Department. Pavement Management. Streets Inspected Every Year Staff evaluates 10 pavement characteristics to determine a street rating (or Pavement Condition Index- PCI) between 0 and 100. PCI Levels Good:100-80 Fair: 79-45

E N D
2012 -2014Street RehabilitationCity of ThorntonInfrastructure Department
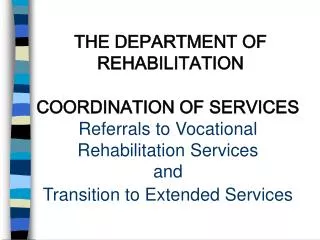
Pavement Management • Streets Inspected Every Year • Staff evaluates 10 pavement characteristics to determine a street rating (or Pavement Condition Index- PCI) between 0 and 100. • PCI Levels • Good:100-80 • Fair: 79-45 • Poor 44-0 • Pavement Management System (Street Database) • Historical Maintenance Data (ongoing) • Current Pavement Conditions • Future Pavement Predictions • Potholes • Visible Patches • Transverse/Longitudinal Cracks • Alligator/Block Cracking • Spider Cracking • Surface Raveling • Rutting • Deflection • Ridability • Priority Level (Arterial, Collector, Residential)
Historical CIP Asphalt Expenditures Asphalt Total CIP Paving Rehabilitation Lane Year $ Per Ton Expenditures Miles % Budget for Each Program 1990 $25.00 $ 284,000 690 100 % Overlay 1991 $25.00 $ 2,360,000 706 100 % Overlay 1992 $22.50 $ 913,000 732 100 % Overlay 1993 $23.50 $ 1,109,000 746 100 % Overlay 1994 $25.00 $ 769,000 788 88 % Overlay, 12% Slurry Seal 1995 $23.50 $ 1,562,000 821 93% Overlay, 7% Slurry Seal 1996 $23.50 $ 2,910,000 855 83% Overlay, 17% Slurry Seal 1997 $22.50 $ 2,987,000 868 97% Overlay, 3% Slurry Seal 1998 $22.95 $ 3,038,000 899 91% Overlay, 9% Slurry Seal 1999 $23.50 $ 4,808,000 923 96% Overlay, 4% Slurry Seal 2000 $26.50 $ 3,528,000 933 98% Overlay, 2% Slurry Seal 2001 $32.00 $ 1,776,000 954 94% Overlay, 6% Slurry Seal 2002 $32.00 $ 1,381,000 1,066 43% Overlay, 57% Slurry Seal 2003 $35.00 $ 1,306,000 1,113 32% Overlay, 68% Slurry Seal 2004 $36.50 $ 1,476,000 1,149 26% Overlay, 74% Slurry Seal 2005 $45.00 $ 1,519,000 1,185 20% Overlay, 80% Slurry Seal 2006 $48.00 $ 1,515,000 1,223 0% Overlay, 63% Slurry Seal, 37% Chip Seal 2007 $85.63 $ 1,650,000 1,263 16% Overlay, 42% Slurry Seal, 42% Chip Seal 2008 $60.00$ 1,650,0001,26526% Overlay, 53% Slurry Seal, 21% Chip Seal 2009 $40.57 $ 1,650,000 1,266 84% Overlay, 6% Chip Seal, 10% Slurry Seal 2010 $38.20 $ 1,650,000 1,275 47% Overlay, 37% Hot Chip, 16% Crack Seal
Historical CIP Asphalt Expenditures Asphalt Total CIP Paving Rehabilitation Lane Year $ Per Ton Expenditures Miles % Budget for Each Program 1990 $25.00 $ 284,000 690 100 % Overlay 1991 $25.00 $ 2,360,000 706 100 % Overlay 1992 $22.50 $ 913,000 732 100 % Overlay 1993 $23.50 $ 1,109,000 746 100 % Overlay 1994 $25.00 $ 769,000 788 88 % Overlay, 12% Slurry Seal 1995 $23.50 $ 1,562,000 821 93% Overlay, 7% Slurry Seal 1996 $23.50 $ 2,910,000 855 83% Overlay, 17% Slurry Seal 1997 $22.50 $ 2,987,000 868 97% Overlay, 3% Slurry Seal 1998 $22.95 $ 3,038,000 899 91% Overlay, 9% Slurry Seal 1999 $23.50 $ 4,808,000 923 96% Overlay, 4% Slurry Seal 2000 $26.50 $ 3,528,000 933 98% Overlay, 2% Slurry Seal 2001 $32.00 $ 1,776,000 954 94% Overlay, 6% Slurry Seal 2002 $32.00 $ 1,381,000 1,066 43% Overlay, 57% Slurry Seal 2003 $35.00 $ 1,306,000 1,113 32% Overlay, 68% Slurry Seal 2004 $36.50 $ 1,476,000 1,149 26% Overlay, 74% Slurry Seal 2005 $45.00 $ 1,519,000 1,185 20% Overlay, 80% Slurry Seal 2006 $48.00 $ 1,515,000 1,223 0% Overlay, 63% Slurry Seal, 37% Chip Seal 2007 $85.63 $ 1,650,000 1,263 16% Overlay, 42% Slurry Seal, 42% Chip Seal 2008 $60.00$ 1,650,0001,26526% Overlay, 53% Slurry Seal, 21% Chip Seal 2009 $40.57 $ 1,650,000 1,266 84% Overlay, 6% Chip Seal, 10% Slurry Seal 2010 $38.20 $ 1,650,000 1,275 47% Overlay, 37% Hot Chip, 16% Crack Seal
Historical CIP Asphalt Expenditures Asphalt Total CIP Paving Rehabilitation Lane Year $ Per Ton Expenditures Miles % Budget for Each Program 1990 $25.00 $ 284,000 690 100 % Overlay 1991 $25.00 $ 2,360,000 706 100 % Overlay 1992 $22.50 $ 913,000 732 100 % Overlay 1993 $23.50 $ 1,109,000 746 100 % Overlay 1994 $25.00 $ 769,000 788 88 % Overlay, 12% Slurry Seal 1995 $23.50 $ 1,562,000 821 93% Overlay, 7% Slurry Seal 1996 $23.50 $ 2,910,000 855 83% Overlay, 17% Slurry Seal 1997 $22.50 $ 2,987,000 868 97% Overlay, 3% Slurry Seal 1998 $22.95 $ 3,038,000 899 91% Overlay, 9% Slurry Seal 1999 $23.50 $ 4,808,000 923 96% Overlay, 4% Slurry Seal 2000 $26.50 $ 3,528,000 933 98% Overlay, 2% Slurry Seal 2001 $32.00 $ 1,776,000 954 94% Overlay, 6% Slurry Seal 2002 $32.00 $ 1,381,000 1,066 43% Overlay, 57% Slurry Seal 2003 $35.00 $ 1,306,000 1,113 32% Overlay, 68% Slurry Seal 2004 $36.50 $ 1,476,000 1,149 26% Overlay, 74% Slurry Seal 2005 $45.00 $ 1,519,000 1,185 20% Overlay, 80% Slurry Seal 2006 $48.00 $ 1,515,000 1,223 0% Overlay, 63% Slurry Seal, 37% Chip Seal 2007 $85.63 $ 1,650,000 1,263 16% Overlay, 42% Slurry Seal, 42% Chip Seal 2008 $60.00$ 1,650,0001,26526% Overlay, 53% Slurry Seal, 21% Chip Seal 2009 $40.57 $ 1,650,000 1,266 84% Overlay, 6% Chip Seal, 10% Slurry Seal 2010 $38.20 $ 1,650,000 1,275 47% Overlay, 37% Hot Chip, 16% Crack Seal
Historical CIP Asphalt Expenditures Asphalt Total CIP Paving Rehabilitation Lane Year $ Per Ton Expenditures Miles % Budget for Each Program 1991 $25.00 $ 2,360,000 706 100 % Overlay 1992 $22.50 $ 913,000 732 100 % Overlay 1993 $23.50 $ 1,109,000 746 100 % Overlay 1994 $25.00 $ 769,000 788 88 % Overlay, 12% Slurry Seal 1995 $23.50 $ 1,562,000 821 93% Overlay, 7% Slurry Seal 1996 $23.50 $ 2,910,000 855 83% Overlay, 17% Slurry Seal 1997 $22.50 $ 2,987,000 868 97% Overlay, 3% Slurry Seal 1998 $22.95 $ 3,038,000 899 91% Overlay, 9% Slurry Seal 1999 $23.50 $ 4,808,000 923 96% Overlay, 4% Slurry Seal 2000 $26.50 $ 3,528,000 933 98% Overlay, 2% Slurry Seal 2001 $32.00 $ 1,776,000 954 94% Overlay, 6% Slurry Seal 2002 $32.00 $ 1,381,000 1,066 43% Overlay, 57% Slurry Seal 2003 $35.00 $ 1,306,000 1,113 32% Overlay, 68% Slurry Seal 2004 $36.50 $ 1,476,000 1,149 26% Overlay, 74% Slurry Seal 2005 $45.00 $ 1,519,000 1,185 20% Overlay, 80% Slurry Seal 2006 $48.00 $ 1,515,000 1,223 0% Overlay, 63% Slurry Seal, 37% Chip Seal 2007 $85.63 $ 1,650,000 1,263 16% Overlay, 42% Slurry Seal, 42% Chip Seal 2008 $60.00$ 1,650,0001,26526% Overlay, 53% Slurry Seal, 21% Chip Seal 2009 $40.57 $ 1,650,000 1,266 84% Overlay, 6% Chip Seal, 10% Slurry Seal 2010 $38.20 $ 1,650,000 1,275 47% Overlay, 37% Hot Chip, 16% Crack Seal
2011 Program Details 2011 CIP Street Rehabilitation Program: $1,650,000 • Asphalt Overlay ~7.0 Lane Miles ($625k) • Asphalt Patching ~1.1 Lane Miles ($200k) • Hot Chip Seal ~13.2 Lane Miles ($625k) • Crack Seal ~ 95.0 Lane Miles ($200k) Concrete Replacement Program: $100,000 In-House Program: $200,000 • Crack Seal ~55 Lane Miles ($50,000) • Patching/Overlay ~ 2 Lane Miles ($150,000) Total Rehab Expenditures: $1,950,000