Download
1 / 8
80 likes | 186 Views
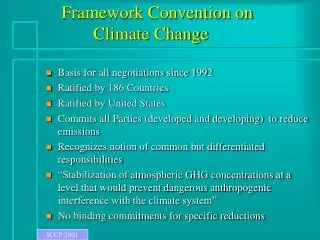
UNFCCC press conference, Bonn, 20 November 2007. Kyoto Protocol “go-live”: data, policies, infrastructures. by Sergey KONONOV (UNFCCC secretariat). United Nations Framework Convention on Climate Change. “Kyoto cornerstones”: data – policies – infrastructures.

E N D
UNFCCC press conference, Bonn, 20 November 2007 Kyoto Protocol “go-live”: data, policies, infrastructures by Sergey KONONOV (UNFCCC secretariat) United Nations Framework Convention on Climate Change
“Kyoto cornerstones”: data – policies – infrastructures Policies and measures to reduce emissions Systems & infrastructures to support GHG emissions data and market-based mechanisms Reports on GHG emissions Emission reduction targets under Kyoto Protocol for industrialized countries: at least –5% by 2008-2012 compared to 1990
UNFCCC press conference, Bonn, 20 November 2007 GHG trends 1990-2005: latest UNFCCC data for industrialized countries by Sergey KONONOV (UNFCCC secretariat) United Nations Framework Convention on Climate Change
Overview / introduction |what data are available now • The data are: • For the period 1990 – 2005 • For Annex I Parties (industrialized countries) • Come from official data submissions under UNFCCC in 2007 • Full data publication = FCCC/SBI/2007/30 (for the Bali meetings) • Two sets of data are presented: • For Annex I Parties to the Climate Change Convention: 41 Parties • For Annex I Parties to the Kyoto Protocol: 38 Parties • Trends for the Convention group and the Kyoto group differ • Caution 1: emission trends 1990–2005 are NOT compliance assessment • Caution 2: trends for group are not equivalent to trend for each country
GHG trends 1990–2005 |Part 1: Annex I CONVENTION Parties (41) • 1990–2005 trend: Annex I emissions remain below the 1990 level • without GHG sinks (excluding LULUCF): -3% (more certain estimate) • with GHG sinks (including LULUCF): -5% (more comprehensive estimate) • by country, changes vary from –59% (Latvia) to +74% (Turkey) 1990–1995: -7% 1995–2000: +2% 2000–2005: +3% from +6% in EITs, +2% in non-EITsfrom +200 Mt in EITs, +260 Mt in non-EITs 2000–2005 trend without GHG sinks: +3% 2000–2005 trend with GHG sinks: +1% (+0.2% in EITs, +2% in non-EITs) Note: LULUCF = Land use, land-use change and forestry; EIT = economy in transition
GHG trends 1990–2005 |Part 2: Annex I KYOTO Parties (38) • 1990–2005 trend: Annex I emissions remain well below the 1990 level • without GHG sinks (excluding LULUCF): -15% • decrease for “Kyoto group” (-15%) deeper than for “Convention group” (-3%) • by country, changes vary from –59% (Latvia) to +53% (Spain) • 2000–2005 trend: Annex I emissions slowly grow since 2000 • without GHG sinks (excluding LULUCF): +3% • for EIT Parties: +6% (resumed economic growth in EITs) • for non-EIT Parties: +2% (continued growth in non-EITs) Note: Kyoto Parties (38) = Convention Parties (41) – Australia, Turkey, US
Conclusions |see also FCCC/SBI/2007/30, unfccc.int • In 2005, emissions were below the 1990 level • for 41 Convention Parties: –(3–5)% • for 38 Kyoto Protocol Parties: –15% • changes vary greatly from country to country Slow growth after 2000 (+3%) is noticeable; needs attention The data reported = reliable basis for tracking emissions in the upcoming Kyoto commitment period 2008–2012
“Kyoto cornerstones”: data – policies – infrastructures Policies and measures to reduce emissions Systems & infrastructures to support GHG emissions data and market-based mechanisms Reports on GHG emissions Emission reduction targets under Kyoto Protocol: at least –5% by 2008-2012


![United Nations Framework Convention on Climate Change [UNFCCC]](https://cdn0.slideserve.com/833451/united-nations-framework-convention-on-climate-change-unfccc-dt.jpg)