Download
1 / 13

E N D
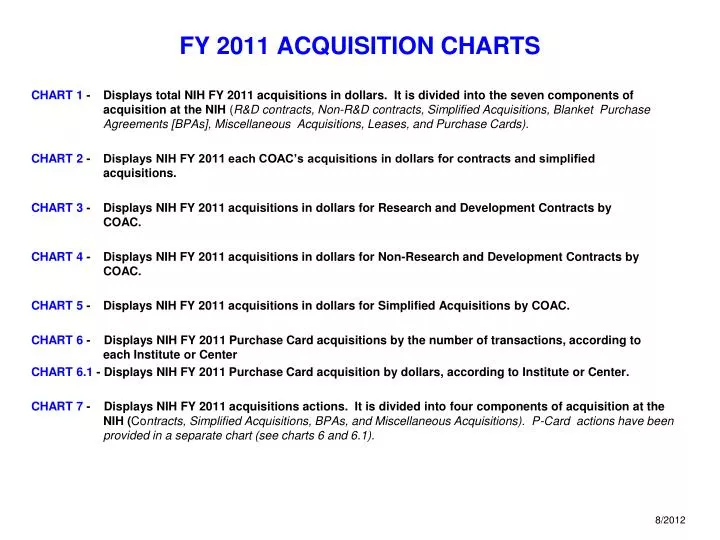
FY 2011 ACQUISITION CHARTS CHART 1 - Displays total NIH FY 2011 acquisitions in dollars. It is divided into the seven components of acquisition at the NIH (R&D contracts, Non-R&D contracts, Simplified Acquisitions, Blanket Purchase Agreements [BPAs], Miscellaneous Acquisitions, Leases, and Purchase Cards). CHART 2 - Displays NIH FY 2011 each COAC’s acquisitions in dollars for contracts and simplified acquisitions. CHART 3 - Displays NIH FY 2011 acquisitions in dollars for Research and Development Contracts by COAC. CHART 4 - Displays NIH FY 2011 acquisitions in dollars for Non-Research and Development Contracts by COAC. CHART 5 - Displays NIH FY 2011 acquisitions in dollars for Simplified Acquisitions by COAC. CHART 6 - Displays NIH FY 2011 Purchase Card acquisitions by the number of transactions, according to each Institute or Center CHART 6.1 - Displays NIH FY 2011 Purchase Card acquisition by dollars, according to Institute or Center. CHART 7 - Displays NIH FY 2011 acquisitions actions. It is divided into four components of acquisition at the NIH (Contracts, Simplified Acquisitions, BPAs, and Miscellaneous Acquisitions). P-Card actions have been provided in a separate chart (see charts 6 and 6.1).
FY 2011 ACQUISITION CHARTS (cont.) CHART 8 - Displays total NIH FY 2011 Contract Actions – R&D and Non-R&D by COAC. CHART 9 - Displays total NIH FY 2011 Simplified Acquisitions actions by COAC. CHART 10 - SOLAR CHART - illustrates the NIH Acquisition Organization and FY 2011 actions. • NOTE: • Contract, Simplified Acquisition, BPA, and Lease data based on DCIS/FPDSng. Data does not include micropurchases. Does not include zero dollars and deobligations. • Purchase card data derived from P-card Bank and Miscellaneous data derived from nVision/PRISM. • BPA Set Ups and GWACS included. • Figures in these charts DO NOT include FY 2011 funds awarded under non-NIH contracts or awarded by non-NIH entities against NIH GWACs.
NIH FY 2011 ACQUISITIONS$5,172.5 B Shows individual dollars in millions and percentages of total dollars. Excludes micro-purchases and de-obligations. Includes zero dollar actions. Non R&D contracts includes NITAAC.
NIH FY 2011 ACQUISITIONSContracts, IDCs, Simp. Acq.By Awarding COAC$4,602.2 B CHART 2 Shows COAC dollars in millions and percentages of total dollars. Excludes micro-purchases and de-obligations. Includes zero dollar actions. *ORF includes Leases $127.7 M. **OLAO includes NITAAC.
NIH FY 2011 ACQUISITIONS$2,527.1 BR&D CONTRACTS CHART 3 Shows COAC dollars in millions and percentages of total dollars. Excludes micro-purchases and de-obligations. Includes zero dollar actions.
NIH FY 2011 ACQUISITIONS$1,851.9B NON-R&D CONTRACTS CHART 4 Shows COAC dollars in millions and percentages of total dollars. Excludes micropurchases, deobligations. Includes zero dollar actions. *ORF includes Leases $128.9. **OLAO includes NITAAC.
NIH FY 2011 ACQUISITIONSSIMPLIFIED ACQUISITIONS $223.2 M Shows COAC dollars in millions and percentages of total dollars. Excludes micropurchases, deobligations. Includes zero dollar actions. CHART 5
Total Purchase Card Spend for FY11 NIH Total Spend for FY11: $302,389,342 Millions Chart 6.1
NIH FY 2011 ACQUISITIONSTOTAL NIH ACTIONS: 478,831 CHART 7 Excludes micro-purchases and de-obligations. Includes zero dollar actions. .
NIH FY 2011 CONTRACTS NUMBER OF ACTIONS: 8,435 CHART 8 Excludes micropurchases, deobligations. Includes zero dollar actions. *ORF includes Leases. **OLAO includes NITAAC.
NIH FY 2011 SIMPLIFIED ACQUISITIONS ACTIONS: 6,197 CHART 9 Includes all FY 2011 simplified acquisition actions executed by NIH.
NIH ACQUISITION ORGANIZATION - COACS FY 2011 OFFICE OF LOGISTICS & ACQUISITION OPERATIONS (NINR, NCMHD, NEI, ORS, NIDCD, NIGMS, OD, NITAAC) CONTRACTS: $282.2 M (R&D 32.3 & Non R&D $249.9) SIMP. ACQ.: $33.5 M TOTAL: $315.7 M GREGORY HOLLIDAY NITAAC CONTRACTS: $51.9M MARY ARMSTEAD NATIONAL CANCER INSTITUTE (NCI, NCCAM) CONTRACTS: $812.0M (R&D $546.2 & Non R&D $265.8) SIMP. ACQ.: $20.1M TOTAL: $832.1M KRISTEN MISTICHELLI NATIONAL INSTITUTE OF ALLERGY & INFECTIOUS DISEASES (NIAID, HHS BIODEFENSE) CONTRACTS: $931.8M (R&D $884.9 & Non R&D $46.9) SIMP. ACQ.: $19.3M TOTAL: $951.1 M CHARLES GREWE NATIONAL CANCER INSTITUTE CONTRACTS: SIMP. ACQ.: TOTAL: NATIONAL HEART, LUNG & BLOOD INSTITUTE (NHLBI, NIAMS, CSR, NIDCR, NIBIB, NCRR, NHGRI) CONTRACTS: $451.2M (R&D $310.7 & Non R&D $141) SIMP. ACQ.: $21.6M TOTAL: $472.8M JOHN TAYLOR NATIONAL INSTITUTES OF HEALTH OFFICE OF ACQUISITION & LOGISTICS MANAGEMENT (OALM) DIANE J. FRASIER (HEAD CONTRACTING ACTIVITY, NIH) TOTAL: $5,172.5 B R&D CONTRACTS: $2,527.1B NON R&D CONTRACTS: $1,851.9B SIMPLIFIED ACQUISITIONS: $223.2B BLANKET PURCHASE AGREEMENTS: $167.5M PURCHASE CARDS: $302.4M MISC: $100.4M OFFICE OF RESEARCH FACILITIES (ALL NIH FACILITIES RELATED ACQUISITIONS) CONTRACTS: $367.9M (R&D $0 & Non R&D $367.9) SIMP. ACQ.: $1.8M TOTAL: $369.7M SHARON BRUCE CLINICAL CENTER (CC) CONTRACTS: $79.1M (R&D $0 & Non R&D $79.1) SIMP. ACQ.: $14.1M TOTAL: $93.2 M Sydney Jones NATIONAL INSTITUTE OF NEUROLOGICAL DISORDERS AND STROKE CONTRACTS: $43.5 M KIRK DAVIS NATIONAL INSTITUTE OF ENVIRONMENTAL HEALTH SCIENCES (NIEHS) CONTRACTS: $141.5M (R&D $105.9 & Non R&D $35.6) SIMP. ACQ.: $6.4M TOTAL: $147.9M CHARLES CONRAD NATIONAL INSTITUTE ON DRUG ABUSE (NIDA, NINDS, NIMH, NIA) CONTRACTS: $362.4M (R&D $299.1 & Non R&D $63.3) SIMP. ACQ.: $36.0M TOTAL: $398.4M JAMES QUINN NATIONAL LIBRARY OF MEDICINE (NLM, NIDDK, CIT, OD) CONTRACTS: $644.6M (R&D $162.8 & Non R&D $481.8) SIMP. ACQ.: $59.1M TOTAL: $703.7M Phil Osborne NATIONAL INSTITUTE OF CHILD HEALTH (NICHD, NIAAA, FIC) CONTRACTS: $254.4M (R&D $185.2 & Non R&D $69.2) SIMP. ACQ.: $11.3M TOTAL: $265.7M OLGA ACOSTA-POLSTON CHART 10 8/2012