Download
1 / 15
150 likes | 232 Views
CSI UNCOVERS MACBETH. Run…but you can’t hide!. SCOTLAND…AROUND 1500. Our action takes place at a gorgeous castle in Inverness, the beautiful but dangerous Bernium woods and beautiful Castle Fife. The Crimes. Your Task. Your task is two-fold:

E N D
CSI UNCOVERS MACBETH Run…but you can’t hide!
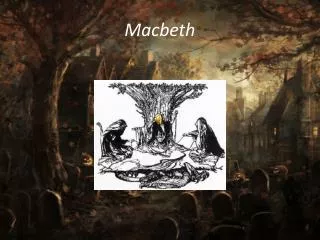
SCOTLAND…AROUND 1500 • Our action takes place at a gorgeous castle in Inverness, the beautiful but dangerous Bernium woods and beautiful Castle Fife.
Your Task Your task is two-fold: • Re-create one of three murder scenes from the play Macbeth. • You will be assigned a scene (obviously one you did not re-create) and you will investigate the crime scene and determine the murderer.
1. Read the play to gather all details regarding your assigned murder 2. Re-create the murder scene. Add evidence that fits the scene. 3.As investigators of another team’s murder scene…begin your investigation. Assign duties for each member of your team. Decide if you will videotape your report, write it, or do a power point presentation. The Process
EVALUATION • Your time (each member taking a turn) will walk through the crime scene giving an explanation for the rationale behind how your recreation. • Referring to the text you will illustrate how you interpreted the scene to look like. • Your group will evaluated based on accuracy, effort, creativity, use of class time. • Each member of the group will assess the other members of their team. The combined mark will determine each members group mark. • For example: • Group mark is 78%, • Liam is in a group of five…Morgan, Stephanie, Ashley and Arlen. • Arlene gives Liam a 80%, Morgan 75%, Stephanie 83% and Ashley a 95%.The group average is
The Players at CSI • Depending on the numbers in your group…some members may be assigned more than one task. • Coroner-determines cause of death, tox report. • Lab Specialist: DNA, fibers, trace materials. • Crime Scene Investigator: processes evidence at the crime scene (photos, collects physical evidence, makes initial theory as to how homicide was committed. • Homicide Detective: interviews suspects, follows leads, apprehends criminals
Secure the crime scene Take photos and collect visible evidence Take statements from witnesses Process the body Process the evidence Interrogate potential suspects Follow all leads If possible make an arrest File your report SECURE THE CRIME SCENE
How to Investigate a Crime Scene. • How to put together a Crime Scene InvestigativeTeam • http://www.crime-scene-investigator.net/index.html • How to Collect Evidence from a Body • http://www.crime-scene-investigator.net/deadbodyevidence.html • Crime Scene Clean-up http://xpress.sfsu.edu/archives/life/000419.html
Tests Available for Identifying Unknowns • Test kits must be must be checked out from the lab by your lab technician. Kits returned in poor condition will result in a fine of 1break paid to the lab. Be aware that because a limited numbers of kits are available for use, your time with the kit may be limited. Please have all of your samples ready to test before you check out a kit. • Chromatography: • This test allows ink mixtures to be separated out into the different dyes and components. To do this the ink dot MUST NOT GET INTO THE WATER OR SOLVENT SAMPLE. You can use strips of filter paper, one end it put into water and the second end is suspended freely so it does not touch the sides of the container. A dot of ink should be about one cm above the water mark. Water will move slowly up the strip and dissolve the ink dyes. The dyes will move with the water based on how soluble they are and the size of the molecules. You will need to run a known sample of ink for the same amount of time and using the same water source to compare your results to. • Flame Test: • This test can be used to identify dissolved metal salts in liquids. Using an alcohol lamp collect a sample of liquid on a loop and put it into the flame. Clean loop each test with a weak acid to reduce contamination. If metal salts are present the flame will change color. This is how fireworks make different colored explosions in the sky. • Soil pH: • This test will tell you how acidic or basic a soil sample is. Collect a sample of soil and add distilled water. Mix and let the water sit for 10-15 minutes then filter the water off of the soil. Using a pH strip mix the water sample for 1 minute with the strip, and compare the results to the scale. • Soil % moisture: • This is a basic test for soil types to determine the organic matter. To do this clean, dry, mark and weigh a beaker. Add distilled water drop by drop to a sample of soil, until one drop of water is released. Allow the sample to sit for 15 minutes, then add more drops of water, again you are watching for water to be released by the soil. When the soil will no longer hold the water remove about one table spoon of soil. Add this soil sample to the beaker then mass the sample. Put the sample on the hot plate and allow it to dry completely! Mass the sample after drying and calculate the % moisture of the soil.
Identifying Unknown Substances cont’d • Baking Soda Water Test: • Baking soda water will react with some acidic powders. Add one drop of baking soda water to a small amount of powder on a piece of foil. Observe for reaction. • Vinegar Test: • Vinegar will react with some basic powders. Add one drop of vinegar to a small amount of powder on a piece of foil. • Observe for reaction. • Iodine Test: • Iodine will react with starch in powders. Add one drop of iodine to a small amount of powder on a piece of foil. Observe for reaction. • Heat Test: • Different types of powders will react differently when heated. Unbend a paper clip. Crimp a small piece of aluminum foil over the wide end. Clamp the narrow end with a clothespin. Place a small amount of powder on foil. Heat over alcohol burner. Observe for reaction. • Microscopic Analysis: • Sometimes a visual test can be used to identify a substance. Place small amount of powder, or fabric, or hair, or dirt on a glass slide. Examine under stereoscopic microscope on low power, using the top light for better illumination. Record your description of the material. • pH Test: • pH tests can be used to determine the acidity of powders. Dissolve the powder in water then dip a pH test strip into the water, observe change in color, and compare the color to the chart on the test strip container to determine pH. • Fabric Test: • Different types of thread in fabric will react differently to heat. Pull one thread from the fabric. Hold it close to the flame of the alcohol lamp, but not directly in the flame. Observe how the thread reacts.
Adding Physics to the Equation • 1. Now your group should try to create a different model for the cooling body using a model from physics. Re-use the data and the general equation for Newton's Law of Cooling (listed below) to make a new mathematical model for this situation (Ti is the initial temperature of the object, Tr is the temperature of the room, and k is the cooling constant associated with human flesh). Find the equation that represents the temperature of the body at a certain time after the murder and re-calculate the time of death using the new formula. (Refer to the Detective’s report for the victim’s body temperature) Again, keep all of your calculations and scratch paper and add them as an Appendix to your Case Report. • 2. Use the graphing calculator "G Calc 3 Beta" to help you generate a graph of your final equation from question #1. Compare this graph to the initial graph you drew in step #1 From the Expotential Decay Graph. Does this graph also make sense? Please print a copy of your graph using the graphing calculator "G Calc 3 Beta" and include it in your Case Report. • 3. Prepare your Case Report as follows: • Your report should be a clear explanation of all of your groups calculations for both graphs and equations, show every step of your mathematical journey. Include sentences to explain your choices or work where ever you believe it would help a reader better understand your calculations.
EXPONENTIAL DECAY GRAPH • 1.As a group, start by making an initial sketch of an exponential decay graph showing the relationship between body temperature and the time that includes an asymptote and any data points where they would be most appropriate. You should label the asymptote in your sketch as well as labeling your data points clearly. Since you have no equation yet, you will just be creating an estimate to guide you as you progress. • 2. Once your group has decided on a graph, make a neat and clearly labeled copy, title it "Initial Graph Estimate", and add it to your Case Report. • 3. Use your data and the general equation (listed below) to find the equation that represents the temperature of the body as a function of time for the dead body. • Keep all of your calculations and scratch paper and add them as an Appendix to your Case Report. • Section 3.3: Constructing Exponential Models: http://campus.northpark.edu/math/PreCalculus/Transcendental/Exponential/Models/ • Math for Morons Like Us: http://library.thinkquest.org/20991/alg2/log.html • Example using Newton's Law of Cooling: http://www.math.wpi.edu/Course_Materials/MA1022A96/lab2/node6.html#SECTION00013100000000000000 • 4. Use the graphing calculator "G Calc 3 Beta" to help you generate a graph of your final equation from question #2. You will need to select the "Planar Graph/Graph Plug-in" to use this tool (you can adjust the window by going to "Edit->Properties". Compare this graph to the initial graph you drew in step #5. Does this graph make sense? Please print a copy of your graph using the graphing utility and include it in your Case Report. • 5. What time did King Duncan, Lady Macduff or Banquo die? Determine how to use the modeling equation your group has created to determine the time of death for the character you have chosen. You will need to solve an exponential equation using the inverse property of logs and make sense out of some weird results. Keep all of your calculations and scratch paper and add them as an appendix to your Case Report.