Download
1 / 23
230 likes | 423 Views
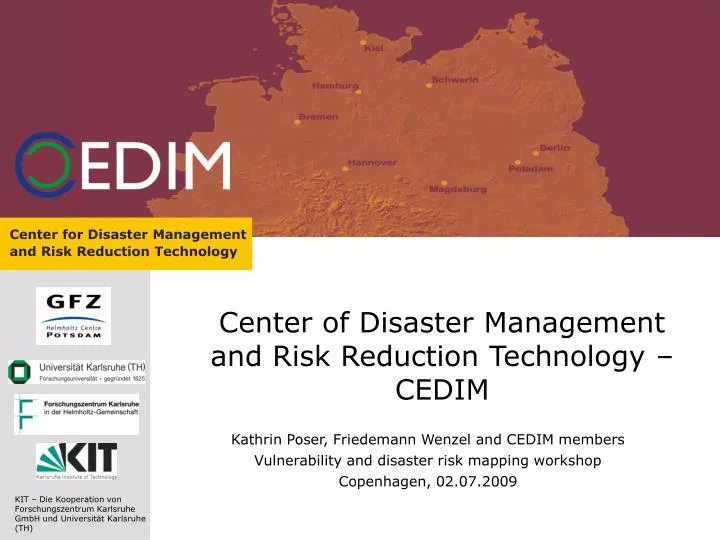
Center of Disaster Management and Risk Reduction Technology – CEDIM. Kathrin Poser, Friedemann Wenzel and CEDIM members Vulnerability and disaster risk mapping workshop Copenhagen, 02.07.2009. Overview. Who we are What we do Risk Map Germany Megacity Istanbul

E N D
Center of Disaster Management and Risk Reduction Technology – CEDIM Kathrin Poser, Friedemann Wenzel and CEDIM members Vulnerability and disaster risk mapping workshop Copenhagen, 02.07.2009
Overview • Who we are • What we do • Risk Map Germany • Megacity Istanbul • Natural disasters under climate change • Global earthquake model
CEDIM History • Interdisciplinary research centre dedicated to fundamental and applied research in the field of disaster management • Founded in 2002 as a cooperation between the University of Karlsruhe and the German Research Centre for Geosciences (GFZ) • Joined in 2007 by Forschungszentrum Karlsruhe • More than 30 scientist from 15 different research units
CEDIM Mission • To advance the science of natural and man-made hazards assessment and develop disaster management solutions for early detection and reduction of risk • create scientific knowledge, technologies and intelligent tools for risk assessment and analysis, risk management and risk communication • co-operate closely with national risk and crisis managing agencies • contribute to key international challenges such as the impact of disasters on megacities and under climate change conditions • communicate experience into the academic sector with the aim of mainstreaming disaster risk reduction in education
Partners and key expertise Engineering: Structural, Electrical, Mechanical, Communication Economic Engineering Logistics EngineeringGeological Hazards Water Ressource Management Geological Hazards Flood Risk Early Warning Systems Satellite Technology Geoinformation Management Meteorology and Climate Research Decision Support Sustainability Analysis Emergency Medicine
Hazard, vulnerability and risk Merz and Thieken (2004)
Classification of disaster impacts Disaster impacts direct indirect tangible intangible tangible intangible Fatalities Business interruptions Psychological damage Material damage Casualties Traffic interruptions Migration Pollution
Risk Map Germany Earthquake Flood Winter storm Man-made hazards Asset estimation Infrastructures Megacity Instanbul Earthquake hazard analysis (tectonic model, microzonation, recent and historic seismicity analysis) Vulnerability and risk (indirect damages, remotely sensed detection of building vulnerability, indicators for socio-economic vulnerability) Topics 2003-2008
Risk Map Germany • Nation-wide quantification of risk for the natural hazards winter storm, flood and earthquake as well as for man-made hazards • Methods to determine and compare the risks on a common spatial scale (municipalities) • Quantifying direct tangible losses (damage to residential buildings)
Hazard modelling Winter storm: Gust speed (m/s) for return periods 2-500 years Earthquake: Macroseismic intensity (EMS98) for return period 475 years Flood: Inundation depth (m) for return period 200/300 years Vulnerability modelling Damage ratio as a function of hazard Using building characteristics Risk Map Germany Thieken et al. (2009)
Risk Map Germany • Asset estimation • Disaggregation of population • Estimation of residential building stock • Estimation of industrial building stock • Presentation • Web-based information system: RiskExplorer Germany (http://www.cedim.de/riskexplorer.php)
Risk Map Germany – risk comparison Saxony • Harmonization of data, methods and return periods Thieken et al. (2009)
Megacity Istanbul • Stress Field Modelling • Local site effects • Fragility and vulnerability • Remote sensing • Land cover • Building density • Building height • Type of roof • Age of buildings • Building classification • Vulnerability curves for building types • Socio-Economic Impacts Hergert (2008), Münich (2008)
Megacity Instanbul: Urban Disaster Risk Index Urban Seismic Risk Index Impact Factor Physical Risk Descriptor Physical Damage Human Losses Social Fragility Lack of Resilience
Megacity Istanbul Using Indicators for Risk Communication and Decision Making • Validation with Expert Group • Interactively analyzing indicators to define importance weights (dynamic sensitivity tool in LDW) • Analyzing indicators for soundness and usability • Implementation with Stakeholders • Managing and organizing a group of target stakeholders in workshops to discuss the outcomes of the MIS. • Aim: stakeholders take ownership of the indicator model and use it in periodic evaluations of the city’s risk Khazai (2009)
Natural Disasters under Climate Change Conditions Floods under Climate Change Vulnerability Infrastructure Networks Agriculture Industry Monitoring of Global Risk Global Earthquake Model (GEM) Earthquake Model Germany Central Asia India Topics 2008-2010 Methods • Modelling • Remote Sensing • Indicators • Data Mining • …
Regional flood hazard in a changing climate • Objectives • Quantify change of flood hazard characteristics and flood risk in small to medium size catchments in a changing climate • Including estimate of uncertainty • Method • Combine regional climate models driven by global models with regional/local hydrological models and observations Schädler et al. (2008)
Regional flood hazard in a changing climate • Three typical river systems (Ammer, Mulde, Ruhr) • 30 years control time series (1971-2000), 30 years prognosis for 2030-2060) • Evaluation of continuous time series modelled with • 2 regional climate models (COSMO-CLM, WRF/MM5) with a resolution <10km, forced by different global climate models • 3 rainfall-runoff models Schädler et al. (2008)
Vulnerability: Indicators Khazai et al. (2008)
Vulnerability: Indirect tangible loss • Vulnerability indicatorsfor the industrial sector Merz et al. (2008)
Analysis of criticality of road sections Overlay with hazard maps Hot spots Vulnerability: Infrastructure Relative Risk Index Hot Spot Map Schulz et al. (2007)
Global Risk Assessment: Global earthquake model Zschau (2008)
Thank you for your attention! www.cedim.de