Download

1 / 17
170 likes | 276 Views
Previously at the OERC Symposium 2007. Encouraging Electricity Savings in a University Hall of Residence Through a Combination of Feedback, Visual Prompts, and Incentives. Presented by: Marthinus Bekker Contributors: Tania Cumming, Dr Louis Leland Jr,

E N D
Previously at the OERC Symposium 2007
Encouraging Electricity Savings in a University Hall of Residence Through a Combination of Feedback, Visual Prompts, and Incentives. Presented by: Marthinus Bekker Contributors: Tania Cumming, Dr Louis Leland Jr, Julia McClean, Niki Osborne, & Angie Bruining Department of Psychology University of Otago
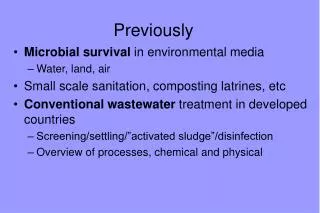
Week 5 Finish Week 6 Week 4 Week 7 Week 3 Week 2 Week 1 Intervention starts at Salmond College, normal readings continue at Cumberland College Electricity Recordings stop at both Colleges Baseline data recording starts at both Colleges How we went about it • Control study with a preceding baseline • Control: Cumberland College • Intervention: Salmond College
Control Cumberland College 326 residents Mostly 1st year University students Aged 18 to 20 years old Gender ratio of 59% female and 41% male Cumberland College is located in Central Dunedin in an old nurses residence A steam plant situated further along the street drives the majority of heating, and hot water Intervention Salmond College 190 residents Mostly of 1st Year University students Aged 18 years or older Gender ratio of 63% female and 37% male Salmond College is located in North Dunedin, in a purpose built building. An on-site steam plant generates heating and hot water The Settings
The Results • Substantial differences between control and intervention savings Please note differences from abstract due to revision of data since
Summary • Use of Feedback, Incentives & Visual prompts • Significant difference in savings • Opportunity for substantial savings across many colleges • Significant savings can be achieved with little effort & investment
Recommendations • Full year study, with first semester as baseline • Long term follow-up to assess spill over • Daily readings (or could do weekly) • Either: • Use control college OR • Regression equation that predicts expected usage from baseline period and temperature, humidity, population, etc..
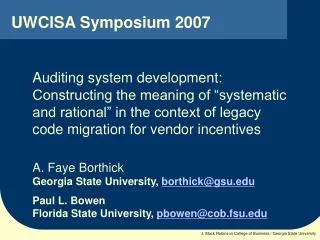
This time at OERC Symposium...
The Phantom Control Group Predicting electricity usage in University Colleges of Residence By: Marthinus Bekker & Dr Louis Leland Jr,
Phantom Control The Idea Control • 326 residents • Mostly 1st year University students • Aged 18 to 20 years old • Gender ratio of 59% female and 41% male • Cumberland College is located in Central Dunedin in an old nurses residence • A steam plant situated further along the street drives the majority of heating, and hot water Intervention • 190 residents • Mostly of 1st Year University students • Aged 18 years or older • Gender ratio of 63% female and 37% male • Salmond College is located in North Dunedin, in a purpose built building. • An on-site steam plant generates heating and hot water Temperature Humidity Previous years usage Day of the Week Light, UVA, UVB Rain ETC….
How we are doing it • Obtain archival electricity with the help of the University’s Energy Manager • Obtain archival weather data through the physics department weather station and NIWA • Obtain other variables such as semester times • Go mining with the various variables using multiple regression analysis
Multiple regression analysis In multiple linear regression, the relationship between several independent variables and a dependent variable is modeled by a least squares function, called the linear regression equation. This function is a linear combination of the various model parameters, called regression coefficients. A linear regression equation with one independent variable would represent a straight line. The results are then statistically analysed for significance and predictive value. Different versions of these equations can then be compared to find the best one.
Equation Multiple regression analysis Previous years usage Temperature Humidity UVB Day of the Week Global radiance UVA Year Period of the Day Day of the Year Rain Wind direction Wind speed Pressure Wind direction Wind speed Rain
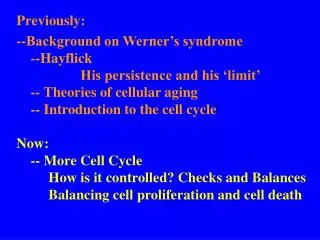
Equation Multiple regression analysis Electricity usage = Last years electricity usage, Hour of day (Dummy), Year, Day of the year, Day x Year2, Temperature, UVA, UVB, Day of the week (Dummy), Global radiance The above variables strongly predicts electricity usage, R2Adjusted (variance explained)=0.929(19,2632), p <0.000 Standard Error=26.880
Graph Electricity usage per 4hr period (kWh) Date
Thank You • OERC for funding this summer bursary project • Hans Pietsch for the electricity data • Brian Niven for help with the non linear transformations • Dr Louis Leland for his guidance and support • Psychology department for the facilities to do all this