Download
1 / 24
250 likes | 378 Views
Life and Death in African Slums. Kenneth Hill. Seminar 4 th February 2013: Center on Population Dynamics, McGill University. Research Team. Günter Fink, Harvard School of Public Health Isabel Günther , ETH Zurich Kenneth Hill, Harvard School of Public Health

E N D
Life and Death in African Slums Kenneth Hill Seminar 4th February 2013: Center on Population Dynamics, McGill University
Research Team • Günter Fink, Harvard School of Public Health • Isabel Günther, ETH Zurich • Kenneth Hill, Harvard School of Public Health • This presentation focuses on sub-Saharan Africa, and is part of a larger project focused on the developing world as a whole; Günter and Isabel have no responsibility for what I present.
Some stylized facts • Up to the 20th century, urban areas had large mortality (and presumably health more generally) penalties • With the application of broad public health measures, the urban advantage in now-developed countries disappeared and eventually reversed in only a few decades • Rapid urbanization in the developing world from about 1950 has not apparently been associated with emerging urban disadvantages in health and mortality indicators • DHS data show a consistent pattern of urban advantage in child mortality
Ratios of urban to rural mortality by age range in dhs surveys Source: DHS Statcompiler
Broad Urban-Rural Patterns • In general, urban advantage averages about 25% • No dramatic differences in advantage by world region • The one outlier is neonatal mortality for Central Asia, unstable because of low fertility • In all regions, the greatest average advantage is for the post-neonatal period • But differences are typically small • So our question is: Do the average urban advantages mask large intra-urban differentials? • In particular, do “slums” do especially badly? • And if so, can we identify any mediating factors ?
But are they unhealthy? Analytic Strategy • Focus on child health and mortality rather than adult • Expected to be more sensitive to living conditions • Better measured from DHS-type surveys • More events given developing country age distributions • Use Demographic and Health Surveys • Over 200 surveys covering a high proportion of the population of the developing world • Sampling methodology selects clusters of households • Information is collected on child mortality (full birth history) and child health status (anthropometry and recent disease episodes) among other things • Socio-economic data to identify “slums”
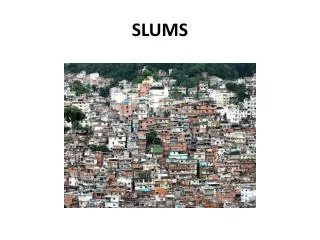
What is a “Slum”? • The UN Habitat definition of a “slum” household is any household lacking any one of: • Improved water • Improved sanitation • Durable structure • Sufficient living space • Security of tenure • We find this definition too broad. • In our view, a “slum” is a neighbourhoodconcept, an area of concentrated poverty in a large urban conglomeration • Our preferred definition is any household in a sample cluster in which at least 75% of households lack at least two of the first four above • We have no reliable data on the fifth criterion
Inclusion criteria • Limit to sub-Saharan Africa for this sub-analysis • Countries with • at least one city of 1+ million in 2010 (as estimated by the UN Population Division) • DHS surveys with information on housing characteristics • Leaves 91 surveys from 36 countries
Definitions • Slum: all households in an urban DHS cluster in which 75% lack 2 or more of • Clean water (piped, borehole or protected well) • Good excreta disposal (other than defecation in the open or unimproved pit latrine) • Adequate space (3 or fewer people per habitable room) • Solid construction (floor of material other than earth, dung, sand or wood) • Distinguish between “cities” and “towns” • “City” we define as an urban area with a population of 1 million or more, “towns” are all other areas classified as urban • In surveys of 25 countries, this can be done using the “province” variable • But in 11 countries, for example those with several large cities, this was ambiguous
Distribution of Children by Slum/non-slum Household definition Unweighted data; N = 165,285
Child Mortality and health Outcomes • Additional impact (over SES effect)of living in a slum we expect to be environmental • Environmental conditions expected to have different effects on different age ranges • Neonatal (< 1 month) • Postneonatal (1 to 11 months) • Child (1 to 3 years) • Limited to exposure in 3 years before survey to reduce effects of population mobility • We use episode of diarrhoea in 2 weeks before interview and stunting (< 2 SD’s below mean height for age) as outcomes for surviving children only
Descriptive Statistics Unweighted data; N = 611,459
Empirical Model To explore differentials in more detail, we fit the following logistic model and sequentially add controls where pijkis the probability of death of child iin cluster jand survey k, Rjare variables for residence, and Sk are survey fixed effects We also subsequently control for a set of mother characteristics not directly associated with those used to define a slum household
Unconditional Associations Note:Standard errors are clustered at the survey-cluster level. • Urban areas (slum and non-slum) have advantage over rural areas on all indicators • Non-slum indicators are always better than slum indicators • City slum indicators are generally better than town non-slum indicators
Is the effect mediated by mother’s education? Note:Standard errors are clustered at the survey-cluster level. • Effects are uniformly smaller • Slum advantage for diarrhoea disappears • On other outcomes city slums still do much better than rural areas • Mother’s education is strongly protective for all outcomes
Or by access to health services? Note:Standard errors are clustered at the survey-cluster level. • Controlling for whether mothers report access to health services to be a problem wipes out any town slum advantage (except for stunting) but increases the city slum and non-slum advantage
Or by a combination of both? Note:Standard errors are clustered at the survey-cluster level. • Town slums now do no better than rural areas except for stunting, but city slums still do better on most outcomes
discussion • How should we define a “slum”? • Do DHS clusters reflect neighbourhoods? • Generally based on census enumeration areas, so probably yes • Slums might be expected to do better than rural areas because of better access to health services • Is there a better way to capture this than mother’s reports? • Are we missing important mediating or confounding factors? • Limited choices because of variables included in the “slum” definition
conclusions • Children in city slums have better health outcomes than rural children • And generally better than children in non-slum areas of towns • Children in town slums have worse outcomes than children in city slums, but generally better than those in rural areas • These advantages are partly explained by: • the better educational profile of slum mothers • Fewer reported problems with access to health services in town slums • For one outcome – stunting – urban children whether in slums or not have much better outcomes than rural children • The mortality advantage is generally largest for children aged 1 to 3 years