Download
1 / 45
460 likes | 573 Views
High Resolution Soil Moisture Estimation via Data Assimilation Using NASA Land Information System. Valentine Anantharaj, Georgy Mostovoy, Anish Turlapaty and Jim Aanstoos Mississippi State University - GeoResources Institute. LIS Evaluation Team & Collaborators. RPC Team

E N D
High Resolution Soil Moisture Estimation via Data Assimilation Using NASA Land Information System Valentine Anantharaj, Georgy Mostovoy, Anish Turlapatyand Jim Aanstoos Mississippi State University - GeoResources Institute NASA Review (7/10/07) 1
LIS Evaluation Team & Collaborators • RPC Team • Valentine Anantharaj, Georgy Mostovoy, Nicholas Younan, Jim Aanstoos, and Anish Turlapaty (MSU) • Christa Peters-Lidard (NASA GSFC HSB) • Paul Houser (GMU CREW) • Bailing Li and Sujay Kumar (GSFC) • Collaborators and Consultants • USDA NRCS • MSU DREC and USDA (Stoneville, MS) NASA Review (7/10/07) 2
Identified Needs of USDA NRCS • Routine analysis soil moisture over the continental needs • water • soils • sun • weather • climate • vegetation • terrain observe, model, assimilate NASA Review (7/10/07) 3
Soil Moisture Data Sources in this RPC Experiment • In-situ observations • USDA Soil Climate Analysis Network (SCAN) • Remotely sensed and estimated • NASA and JAXA Aqua Advanced Scanning Microwave Radiometer – EOS (AMSR-E) • Numerical Models • The Noah model in the NASA Land Information System NASA Review (7/10/07) 4
USDA NRCS SCAN NASA Review (7/10/07) 5
Anticipated Societal Benefits • provides critical information to support drought monitoring and mitigation • provides essential information for predicting droughts based on weather and climate predictions • supports irrigation water management • supports fire risk assessment • supports water supply forecasting and NWS flood forecasting • supplies a critical missing component to assist with snow, climate and associated hydrometeorological data analysis • supports climate change assessment • enables water quality monitoring • supports a wide variety of natural resource management & research activities such as NASA remote sensing activities of soil moisture and ARS watershed studies. NASA Review (7/10/07) 6
Inputs Outputs Physics Water Supply & Demand, Agriculture, Hydro- Electric Power, Ecological Forecasting, Water Quality Improved Short Term & Long Term Predictions Land Surface Models (LSM) Physical Process Models Noah, CLM, VIC, SiB2, Mosaic, Catchment, etc. Energy Fluxes: Le & H Topography, Soils Land Cover and Vegetation (MODIS, AMSR, TRMM, SRTM) Biogeo-chemistry: Carbon, Nitrogen, etc. Meteorology Modeled & Observed (TRMM, GOES, Station) Water Fluxes: Runoff Observed Land States (Snow, ET, Soil Moisture, Water, Carbon, etc.) Surface States: Moisture, Carbon, Ts Data Assimilation Modules (EnKF, EKF) Rule-based (Peters-Lidard, Houser, Kumar, Tian, Geiger) An Integrated Framework forLand Data Assimilation System Applications NASA Review (7/10/07) 7
LIS Evaluations: Purpose and Activities NASA Review (7/10/07) 8
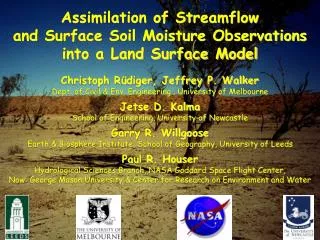
Purpose of RPC Evaluations … • Primary: • Evaluate LIS capabilities and NASA data to enhance and extend USDA-NRCS SCAN • Approach: • Evaluate LIS performance • Assimilate SCAN and AMSR-E observations and evaluate LIS capabilities to enhance SCAN by means of Observation Sensitivity Experiments (OSE) • Derive physically consistent soil moisture maps at a range of spatial resolutions from 25x25 km2 to 1x1 km2 • Quantify uncertainties at all scales NASA Review (7/10/07) 9
Team Activity • MsState: Project Management, RPC Integration, Control Run, MODIS-VF, [SSURGO] • NASA GSFC: LIS Support, AMSR-E data assimilation, science expertise • GMU CREW: SCAN data assimilation, science expertise NASA Review (7/10/07) 10
Data Assimilation and Observation Sensitivity Experiments • Evaluation of data assimilation techniques • EKF, EnKF • Data assimilation (land state) • Soil moisture • Soil moisture stations • AMSR-E • Temperature • MODIS LST [?] • Sensitivity studies • Expected Outcomes:high resolution soil moisture analysis product, uncertainty characterization NASA Review (7/10/07) 11
Status of Current Activities • Preliminary evaluation of simulated soil moisture data – Georgy Mostovoy • Quality Assessment of soil moisture measurements: AMSR-E and SCAN - Anish Turlapaty NASA Review (7/10/07) 12
Future Directions • Assimilate AMSR-E soil moisture data. • Evaluate AMSR-E impacts. • Incorporate MODIS Vegetation Fraction (VF) and compare with control run. • Evaluate MODIS VF impacts. • Assimilate SCAN soil moisture data. • Evaluate SCAN impacts. NASA Review (7/10/07) 13
AMSR-E on NASA AQUA Satellite Noah Land Surface Model of NASA Land Information System Soil Climate Analysis Network Soil Moisture Data EnKF DA No DA Soil Moisture Data Soil Moisture Data Soil Moisture Data Evaluation Study ASMR-E Soil Moisture Data Assimilation and Evaluation NASA Review (7/10/07) 14
Future plans:Assimilation of AMSR-E soil moisture data 1/2 hr forecast+obs 1/2 hr forecast+obs 00Z 03Z 06Z 09Z 12Z 15Z 18Z 21Z 00Z ··· 1/2 hour time step, 3 hourly output, and 5 ensemble members Data assimilation frequency will be twice daily at 06Z and 18Z. DAwill not be “turned on” until observation is available. We plan to take the ensemble mean as first guess for next time step initial conditions NASA Review (7/10/07) 15
Expected Result: [Example Only!] EnKF Assimilation of AMSR-E SM Retrievals Noah LSM RUN AMSR-E SM EnKF Assimilation(TEST2) Example Only! EnKF Assimilation of Scaled AMSR-E SM Retrievals Noah LSM RUN Scaled AMSR-E SM EnKF Assimilation (TEST2) NASA Review (7/10/07) 16
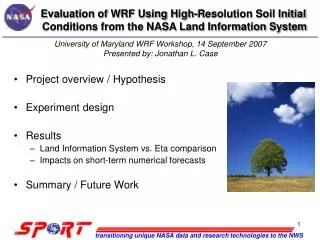
Preliminary Evaluation of Soil Moisture Simulated by the Noah Land Surface ModelGeorgy Mostovoy NASA Review (7/10/07) 17
Geographical distribution of SCAN sites OBJECTIVE: Validation of the Noah Land Surface Model (LSM) baseline runs versus SCAN soil moisture observations
P P N P N P 0 N P N 0 P P – dominant (across var. seasons) positive bias (high temporal variability of SM, drying is rather rapid) N – dominant negative bias (SM exhibits low variability, sluggish behavior in comparison with other sites) 0 – zero bias
Silver City, MS Marianna, AR a flat terrain prevails
Total water content (w) within a soil layer of an arbitrary depth (10 cm, 1 m, or 2 m, for example) E - evaporation rate (calculated based on air 2-m T, q, P, and wind speed from NLDAS) P – precipitation rate (prescribed from the NLDAS data) D – exchange rate with adjacent soil layers (calculated based on soil type and w)
1. Analogy with AR(1) process, or the Markov chain Considering a drying stage (P = 0) , where and α is evaporation efficiency. Relationship between the correlation scale and evaporation efficiency (Δt = 1 day was used) is the autocorrelation function value for the time lag Δt. For an arbitrary time t (t = n Δt, n = 0,1, 2, …), the autocorrelation function is defined as follows: Given this simple model, the evaporation term controls the soil moisture memory is the integral correlation scale, which defines the soil moisture “memory”.
2. An equation for the soil moisture error δw An accumulated soil moisture error for the time period T can be written as follows:
Persistency (“memory”) of soil moisture initial anomalies during Fall 2005 • Both cases suggest that local factors such as soil physical properties, water table, etc. control dynamics of soil moisture anomalies (deviations from a regionally-mean). • This also implies a little control of precipitation on the initial soil moisture state and its dynamics over the Mississippi Delta Region. • (Maximum soil moisture values are bounded by the field capacity = the soil porosity). • Sub-monthly time scales are considered (2-3 weeks periods) 1. Weak memory case: an initial positive anomaly between two SCAN sites disappears after about 40 days. 2. Strong memory case: an initial positive anomaly persists and amplifies during 40-days
Example of soil moisture comparison (averaged over 12 SCAN sites) between SCAN and simulated by Noah Observed soil moisture (averaged over 12 SCAN sites) evolution at different depths during Fall 2005 /error bars stand for standard deviation (SD)/ Low SD Drying out High SD Precipitation event SM underestimation O v e r e s t i m a t i o n (evaporation deficiency of the Noah model) Wet state -> low SD Dry state -> high SD
Outline for baseline soil moisture simulations over the MS Delta region (I) • Noah Land Surface Model (v. 2.7.1) available from LIS (v. 4.3.1) was used for • retrospective runs (years 2005 and 2006) • 1-km domain size: 256x256 points (2.55x2.55 latitude-longitude) • North American Land Data Assimilation System (NLDAS, Cosgrove et al., 2003) atmospheric forcing was used (specified at approx. 15-km grid) • 1-km, 5-km, and 15-km horizontal grid for the Noah model runs (no substantial difference in 5-cm soil moisture content between 1-km, 5-km, and 15-km runs was observed) • Statsgo Soil Data
Outline for baseline soil moisture simulations over the MS Delta region (II) • One year (2004) spin-up period was used for the Noah model • Soil moisture observations available from 12 SCAN sites (subjective QC: visual inspection of • plots) were used for validation of the baseline simulations (daily- • mean values of SM were compared). • Frequency distributions of soil moisture and precipitation • errors were plotted for two-month periods (March-April, May-June, July-August, Sept.-Oct.) • spanning years 2005 and 2006.
P – dominant (across var. seasons) positive bias N – dominant negative bias 0 – zero bias May-June 2005 0 0 N P N N P P P P P
Frequency distribution of soil moisture content error (5-cm daily-mean value simulated by Noah model at 1-km grid minus observed at SCAN site)and difference between NLDAS precipitation forcing and observed local values at SCAN sites March-April 2005 Numbers in upper right corners stand for total number of precipitation eventsregistered either by observations or by NLDASdata (upper row) within two-month period, mean difference or bias and standard deviation between simulated and observed soil moisture (middle and lower rows respectively)
Error sensitivity of simulated maximum 5-cm SM content to error of the NLDAS precipitation forcing No apparent relationship was found between precipitation and 5-cm SM biases (measured as simulated minus observed value) from examination of error distribution histograms. Left frame shows a scatterplot between simulated minus observed maximum SM within each two-month period and a corresponding precipitation error bias. The scatterplot suggests no significant linear relationship (a correlation coefficient R = -0.12 is not significant) between the precipitation and SM errors for maximum values of SM.
Soil texture: Local samples versus Statsgo data Impact on 5-cm SM bias • No apparent association between soil texture (and its variability with depth, presented in the left lower frame) and a sign of the SM bias was observed. Conversely, horizontal distribution patterns of simulated SM is controlled by corresponding patterns of the soil texture map (figures not presented). • Because of relatively high persistence (across different years and months) of a bias sign at a particular scan site it is possible to stratify all scan sites into three category (with significant positive, negative, and small/zero bias) according to this sign. Specifically, six sites (N. Issaquena, Perthshire Farm, Tunica, Earle, Campus, and Lonoke Farm) demonstrated rather persistent positive SM bias. At four sites, such as Beasley Lake, Vance, Marianna, and DeWitt) a negative SM bias was dominant. Two sites (Silver City and Good Timber Creek) showed a relatively small SM bias. • Both positive and negative significant SM biases occurred mostly during drying stages of soils’ matter. This fact suggests that an accurate description/specification of other factors (such as upper/lower boundary conditions for the SM, atmospheric evaporation, etc.) in addition to precipitation forcing is critical for reduction of the SM error. 4 – Silt Loam 8 – Silty Clay Loam 9 – Clay Loam 11 – Silty Clay Soil texture vertical heterogeneity (numbers indicate scan sites) Increase of clay content Decrease of sand content with depth Dominant positive SM bias – dotted lines Dominant negative or “zero” – solid lines
Soil texture variations with depth Seasonality of soil moisture biases at 5-cm depth
Summary • The Noah model performance was evaluated against soil moisture • observations at 12 sites during the years 2005 and 2006 • The Noah model demonstrates a reasonable skill over the Mississippi • Delta Region with a typical bias of 5%. The Noah model produces an • overestimation during drying out periods. This deficiency might be • fixed by adding the assimilation capability of soil moisture • observations (SCAN and AMSR-E) into the Noah model.
Quality Assessment of AMSR-E Soil Moisture DataAnish Turlapaty NASA Review (7/10/07) 38
PROBLEM DESCRIPTION Noah Land Surface Model of NASA Land Information System Soil Moisture Data Assimilation AMSR-E • Data Validation: Before data assimilation, AMSR-E soil moisture data product has to be validated. NASA Review (7/10/07) 39
GENERAL APPROACH • Test Data:Soil moisture data is collected from AMSR-E for the years 2005, 2006 for Mississippi and Arkansas. • Training Data:For validation purposes, soil moisture data from 20 locations of SCAN network in Mississippi and Arkansas is used. • Quality control tool:One class support vector machines which provide a quality value for each time series. NASA Review (7/10/07) 40
Quality Level Remarks on Quality 5 Good quality data 4 Marginal quality 3 Marginal quality 2 Poor data 1 Invalid data RESULTS: Quality Map SVM method
Quality Level Remarks on Quality 5 Good quality data 4 Marginal quality 3 Marginal quality 2 Poor data 1 Invalid data Quality Maps Contd. • QC values are assigned at each pixel (28x23) Mahalanobis Method
SUMMARY • Quality maps are developed for Mississippi and Arkansas, which show the quality of time series at each pixel on scale of five to one. • These results are compared with quality map from Mahalanobis method. • Currently, we are looking for a conventional quality control tool with which these results can be verified. NASA Review (7/10/07) 43
Questions? NASA Review (7/10/07) 44
Contact InformationValentine Anantharaj<val@gri.msstate.edu>Tel: (662)325-5135 NASA Review (7/10/07) 45