Download
1 / 44
440 likes | 512 Views
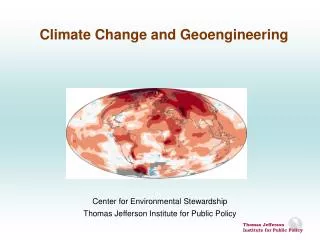
Center for Environmental Stewardship Thomas Jefferson Institute for Public Policy. Current Information about the Global Climate and its Implications on the IPCC/UN Assumptions and Virginia Climate Objectives.

E N D
Center for Environmental Stewardship Thomas Jefferson Institute for Public Policy Current Information about the Global Climate and its Implications on the IPCC/UN Assumptions and Virginia Climate Objectives Submitted to the Virginia Climate Change Commission, and consisting of additional research and analysis supplementing the May testimony. August, 2008
Center for Environmental Stewardship Thomas Jefferson Institute for Public Policy Why Reexamine Current Climate Change Science? • Responding to Climate Change could require significant public and private investment. • To make that investment, the public and the marketplace will have to forego other opportunities. • As the Virginia Climate Commission prepares to make recommendations, it has a fiduciary duty to the public to fully evaluate the threats posed by climate change and the resultant harm from failing to make other public and private investments. • This presentation will help the Commission’s due diligence in risk management.
Center for Environmental Stewardship Thomas Jefferson Institute for Public Policy Managing Threats to Public Welfare – Evaluating the Risk - Risk Tradeoff • The level of certainty about risks controls the investment strategy for every public decision. • The less certain the knowledge about risks, the more conservative an acceptable investment strategy. • An oft claimed exception to this hard rule arises when the risk is potentially catastrophic and, but for the investment, all will be lost. • If the investment is small, wise public policy is to make an investment as insurance against such a catastrophe. • Where the investment is large and would cause an increase in other threats to public welfare, wise public policy requires a step-wise approach that provides for some insurance against the catastrophe while taking time to increase certainty about the actual risk and while allowing for satisfaction of other public welfare goals. • Evaluating how to respond to the threat of catastrophic climate is no different that evaluating any other proposed public investment.
Center for Environmental Stewardship Thomas Jefferson Institute for Public Policy The Key Risk Management Question • Are we confronting a climate catastrophe, and if so, • - does that requires an immediate, short-term and large investment response; or, • - will a long-term investment strategy suffice? • If we accept the IPCC assumptions, the threat of a 2° C rise in temperature, we will NOT suffer catastrophic climate change because, inevitably, someone will apply geoengineering solutions to reduce the global temperature. • This permits a long-term strategy for shifting to non-carbon energy.
Center for Environmental Stewardship Thomas Jefferson Institute for Public Policy The Climate Alarmist Response to Geoengineering • Alarmists claim Geoengineering poses unknown risks that can be as great at the risk of a 2° C temperature rise; and, • Geoengineering poses a moral hazard as it can reduce the willingness to make drastic cuts in carbon emissions. • Response: • It is too late to prevent a 2° C rise through carbon emission reductions, alone, thus disposing of the moral hazard. • The geoengineering community strongly disputes the alarmists characterization of known and unknown risks. • The alarmists’ argument simply adds an additional factor (geoengineering risk) to the risk management decision • Thus, the key question remains, what are the risks and how certain are we of their magnitude?
Center for Environmental Stewardship Thomas Jefferson Institute for Public Policy The Risks Needing Management • The risk of significant economic harm from attempts to meet the carbon reduction goals; • The risk from geoengineering; • The risk of a 2° C rise in global temperature; and, • The risk of a long-range strategy, with concurrent evaluation of emerging climate risks.
Center for Environmental Stewardship Thomas Jefferson Institute for Public Policy The Economic Risk • We know the risk of massive economic dislocation resulting from an immediate crash program to reduce carbon emissions sufficiently to prevent the alarmists’ prediction of a climate catastrophe. • According to the IPCC, it will cost between $4 to $17 Trillion to limit CO2 to 450 ppm, and that will provide only a 50% chance of preventing a 2° C reduction in global temperature, and the concomitant climate catastrophe. • The current U.S. Federal Budget is $2.2 Trillion. • The 2006 U.S. GDP was $13 Trillion. • We cannot afford the alarmists’ proposal, and it is too late to use this as the only approach in any case.
Center for Environmental Stewardship Thomas Jefferson Institute for Public Policy Source: IPCC 2001 Report available at: http://www.ipcc.ch/pdf/climate-changes-2001/correctionfig73.pdf
Center for Environmental Stewardship Thomas Jefferson Institute for Public Policy The Risks of Geoengineering • The risks depend on the form of geoengineering • The risk from cloud whitening does not appear to pose any meaningful risk, but will not address ocean acidification. • The risk from stratospheric aerosols is less well known, but modeling suggests a miniscule effect on the ozone layer and changes in rainfall patterns that are well within common annual variations. • The risk from ocean iron fertilization is similar to using monoculture agriculture (loss of some biodiversity) but only in limited areas; and this approach actually reduces ocean acidification. • Other approaches are too theoretical to evaluate. • The risks associated with geoengineering are far less than the risk of relying on carbon reduction alone.
Center for Environmental Stewardship Thomas Jefferson Institute for Public Policy The risk of a 2° C rise in global Temperature What is the current assessment of the IPCC prediction that, without immediate and drastic carbon reduction, temperatures will rise by 2° C and the world will suffer a climate catastrophe? • Competent scientists have begun to seriously reject the IPCC assumptions and predictions. • Alternative climate projections have forced the IPCC to begin to reevaluate their assumptions. • There is no longer a scientific consensus that observed temperature increases are due to human activity, although there may still be a political consensus.
Center for Environmental Stewardship Thomas Jefferson Institute for Public Policy What are the inconvenient scientific findings that call the IPCC projections into question? • The IPCC “consensus” on temperature change is hollow. • The actual temperature trend over the past 30 years is (statistically significantly) less than the IPCC prediction; • The temperature “record” is polluted; • Several “natural” climate forcings appear to account for temperature variations;
Center for Environmental Stewardship Thomas Jefferson Institute for Public Policy The IPCC “consensus” is hollow • The IPCC calls their “consensus” that humans are causing an increase in global temperature “very likely”, suggesting that there is 90% chance that it is correct. • The IPCC terminology seems to reflect some kind of statistical analysis, but it does not. They admit their confidence reflects no more than “expert judgment.” • The actual consensus stems from one datum, that the 22 general circulation (climate) models agree with reality on the global temperature at the planetary surface, and generally agree with each other. • The IPCC models do not, however, agree with reality at anywhere in the atmosphere, places that provide the most critical energy exchanges within the models. Source: http://www.ipcc.ch/pdf/assessment-report/ar4/wg1/ar4-wg1-spm.pdf
Center for Environmental Stewardship Thomas Jefferson Institute for Public Policy
Center for Environmental Stewardship Thomas Jefferson Institute for Public Policy IPCC Failure to Explain and Predict Temperature Changes • The IPCC demonstrates the failure of their models in the preceding graph. Note, while the models tend to agree with each other, they completely fail to describe the actual temperature gradient above the surface of the earth. • The IPCC also demonstrates this in the “red spot” diagram below. The IPCC models predict a major temperature rise in the critical atmospheric region shown as the large red area in the middle of the left diagram. The right diagram is the actual temperature gradient. You cannot find this big red hot spot above the equator. • Thus, the IPCC’s own data, alone, draw serious question as to the validity of the IPCC conclusion.
Center for Environmental Stewardship Thomas Jefferson Institute for Public Policy Source: http://heartland.temp.siteexecutive.com/pdf/22835.pdf
Independent scientific analysis documents the apparent invalidity of the IPCC assumptions regarding rising global temperature. • Argonne National Laboratory’s Dr. Liljegren examined the past 7 years data, showing the IPCC estimate is outside the 95% confidence interval of the “actual” global temperature.
Argonne National Laboratory’s Dr. Liljegren examined the past 7 years data, showing the IPCC estimate is outside the 95% confidence interval of the “actual” global temperature.
The Huntsville Alabama Satellite Data over the past 30 years also appear to invalidate the IPCC temperature increase prediction. • The Huntsville data set shows a slow rise in temperature over the past 30 years with a leveling off beginning in 2000. • The IPCC prediction of 2° C per year quickly departs from the actual temperature trend. • The Actual temperature trend is one-fourth the IPCC estimate. • Taking into account a 95% confidence interval, the IPCC estimate becomes statistically invalid by 2000. • The trend over the past 7 years is clearly different from the IPCC estimate.
Center for Environmental Stewardship Thomas Jefferson Institute for Public Policy IPCC Temperature Prediction Current 8 year Trend Actual 30 year Trend With 95% Confidence Interval Source: http://vortex.nsstc.uah.edu/data/msu/t2lt/uahncdc.lt Accessed August 24, 2008
There are other anomalies the IPCC Models fail to explain. • The urban heat island effect has been long known, making data from urban centers unreliable indicators of global warming. • Rural data, however, should demonstrate global warming, but it doesn’t.
Urban Rural 1880 1900 1920 1940 1960 1980 2000 Urban versus Rural Temperature Change 1890 - 2007 Source: Climate Audit http://www.climateaudit.org/?cat=51
In addition, the temperature data upon which the IPCC relies has repeatedly had to be corrected and independent scientists continue to find errors. • For example, this Tucson weather station holds the record for the greatest positive temperature trend for all US National Weather Service stations, and the reason is obvious.
Once located in an open meadow, this weather station is now on a tarmac parking lot and is frequently subject to the hot exhaust of slow moving vehicles. No wonder it has had the largest increase in temperatures of all weather stations in the U.S.
A final example of the disconnect between reality and the IPCC’s assumptions can be seen in the Mona Loa CO2 data shown in the next graph. • Note, the actual CO2 increases do not reflect the UN’s predictions made in 2000. • Nor do the actual CO2 increases reflect the estimated increases in carbon emissions. • These kinds of “data disconnects” seriously undermine the legitimacy of the IPCC predictions.
UN Carbon Emission Estimates UN 2000 CO2 Prediction Reality – Mona Loa CO2
There are competing scientific explanations for observed temperature rise that reflect natural cycles. • The IPCC models do not incorporate the Pacific Decadal Oscillation, the largest weather maker on the planet. • A weather pattern larger than the entire United States, it is shown as the blue horseshoe shape in the Pacific Ocean • This graphic reflects the status of the “PDO” as of July 20, 2008, as it enters a new cooling period.
Center for Environmental Stewardship Thomas Jefferson Institute for Public Policy The Pacific Decadal Oscillation Source: http://wattsupwiththat.wordpress.com/2008/07/20/shifting-of-the-pacific-decadal-oscillation-from-its-warm-mode-to-cool-mode-assures-global-cooling-for-the-next-three-decades/
As the chart below demonstrates, this influential pattern oscillates from a warm period to a cool period in a 20-45 year cycle. • The temperature increase from 1900 to 1946 reflects the PDO cycle from cool to warm. No one has ever claimed that this warming reflects human activity. • The temperature increase from 1970 to 1998 has the identical temperature trend as does its previous PDO cycle. The IPCC claims that this increase, however, is due to human causes. • At the moment, temperatures are falling, again in line with the PDO cooling cycle. Dr. Easterbrook predicts a continuation of this cycle into the next century. • The overall temperature trend not attributable to the PDO, and existing before the significant increases in CO2 emissions is the same underlying increase observable from 1970 through today. That rise is a background 1° C rise per century, reflecting a different natural cycle – probably that of the sun.
Center for Environmental Stewardship Thomas Jefferson Institute for Public Policy The Pacific Decadal Oscillation Today Source: http://wattsupwiththat.wordpress.com/2008/04/29/more-on-the-pdo-shift-cited-by-nasa/
Center for Environmental Stewardship Thomas Jefferson Institute for Public Policy • The IPCC discounts the effect of solar cycles, but solar scientists have documented a robust and long-term relationship between solar cycles and global temperature. • The pictures below represent the two aspects of the sun, on the left, high sunspot activity, on the right, no sunspot activity. • As the following slides explain, extended low sunspot activity has been associated with significant temperature reductions, while high sunspot activity has the opposite effect.
Center for Environmental Stewardship Thomas Jefferson Institute for Public Policy Sunspots and the Shift of the Solar Magnetic Field September 14, 1999 August 23, 2008 Source: http://sohowww.nascom.nasa.gov/gallery/images/superprom.html http://sohowww.nascom.nasa.gov/data/realtime/mdi_igr/512 http://www.warwickhughes.com/agri/Solar_Arch_NY_Mar2_08.pdf Source: http://sohowww.nascom.nasa.gov/data/realtime/mdi_igr/512/
Center for Environmental Stewardship Thomas Jefferson Institute for Public Policy • A typical sunspot cycle takes 11 years. • When a cycle extends to 13 years, as is now happening, the sun is quiescent and temperatures drop. • When multiple cycles have low sunspot counts, temperatures drop dramatically and glaciers grow quickly. • Note the “Dalton” minimum around 1800. • Some predict this pattern is beginning to emerge today.
Center for Environmental Stewardship Thomas Jefferson Institute for Public Policy The Sunspot Cycles September 14, 1999 August 23, 2008 Source: http://sohowww.nascom.nasa.gov/gallery/images/superprom.html, http://sohowww.nascom.nasa.gov/data/realtime/mdi_igr/512, http://www.warwickhughes.com/agri/Solar_Arch_NY_Mar2_08.pdf
Center for Environmental Stewardship Thomas Jefferson Institute for Public Policy • Note in the graph below the association between the “Dalton” period of few sunspots and the significant temperature drop. • History records a similar event of even greater magnitude around 1790. • Dr. Archibald has closely examined the sunspot cycle patters over the past 350 years and predicts we are entering a “Dalton” or “Maunder” minimum which will cause temperatures to drop 1° to 2 ° C over the next 40 years.
Center for Environmental Stewardship Thomas Jefferson Institute for Public Policy 24 years of low sunspot activity the last half of which produced 1 degree of cooling Source: http://www.warwickhughes.com/agri/Solar_Arch_NY_Mar2_08.pdf
Center for Environmental Stewardship Thomas Jefferson Institute for Public Policy • Another long-term natural temperature cycle casts still further doubt on the IPCC predictions. • These are 50,000 year cycles that have been observed in ice cores. • They mark the “ice ages” of the planet. • The graph below documents four great ice ages (the troughs) and their respective “interglacial” temperature spikes. • Note the current “interglacial” period is in its final stages.
Center for Environmental Stewardship Thomas Jefferson Institute for Public Policy Source: http://www.warwickhughes.com/agri/Solar_Arch_NY_Mar2_08.pdf
Center for Environmental Stewardship Thomas Jefferson Institute for Public Policy • By laying the temperature data for each glacial cycle on top of each other, a clear pattern emerges. • The current cycle is shown in bright pink. • It appears to be following the two previous cycles, and can reasonably be expected to commence a temperature drop that will lead to the next ice age. • If this cycle looks like the past two, there will be a 0.2° to 0.3° C decline over the next century, as opposed to a 2 ° C increase as predicted by the IPCC.
Center for Environmental Stewardship Thomas Jefferson Institute for Public Policy 2000 2100 { One degree Centigrade 2200
Center for Environmental Stewardship Thomas Jefferson Institute for Public Policy • The purpose of the last 25 slides is not to “impeach” the IPCC report. • The point is that the IPCC predictions have competitors of considerable merit – ones that lead to very different outcomes. • Thus, when considering how to manage the touted risk of a 2° C temperature increase, a wise approach would incorporate the major uncertainty of the presumed threat. • These facts recommend a long-range carbon reduction strategy that does not compromise other public welfare goals and that can be adjusted to reflect data that will emerge as the years pass – data that will better explain the risk of a temperature change.
Center for Environmental Stewardship Thomas Jefferson Institute for Public Policy What are the risks of a long-range strategy, with concurrent evaluation of emerging climate risks A long-range strategy that reduces dependence on carbon-based energy over the next century - - • Will not compromise other public welfare opportunities • Will not pose a moral hazard • Will not imply a climate catastrophe • Will allow Virginia and the U.S. to remain economically competitive with nations like India who reject the assumption of anthropogenic warming and who have rejected carbon-emission reductions in favor of a growth in reliance on carbon-based energy.
Center for Environmental Stewardship Thomas Jefferson Institute for Public Policy What would a long-range strategy to shift from carbon-based energy look like? At the request of Speaker Howell, the Center for Environmental Stewardship prepared “A Climate-Friendly Energy Policy” attached to this briefing. It begins with the following 9 objectives: 1. A secure, plentiful, and diverse primary energy supply; (essential) 2. A robust, reliable infrastructure for energy conversion and delivery; (essential) 3. Affordable and stable energy prices; and 4. Environmentally sustainable energy production and use. 5. A reduction in green house gases (GHG) emissions; 6. Technology advancement or infrastructure development that will reduce the costs of achieving GHG emissions reductions in the future; (essential) 7. New capital investment in assets that would not be substantially devalued (or “stranded”) if a GHG program were implemented; 8. A larger (state and federal) domestic share of energy production; (essential) and, 9. Beyond affordability, cost-competitive energy that eliminates job movement from Virginia to state and federal “foreign” competitors (essential) .