Download
1 / 1
10 likes | 130 Views
130 000 000. 13 000 000. 4200. Y(X 0 )=Y 0. 1 300 000. 130 000. 17 000. Amplification : +. 420. 42. Intermediate precision. No amplification : -. for 2, 4, 8, 10 and 16 runs data are grouped. ~ 10 calibrations (run) needed to set a robust platform cut-off value. bias. variance.

E N D
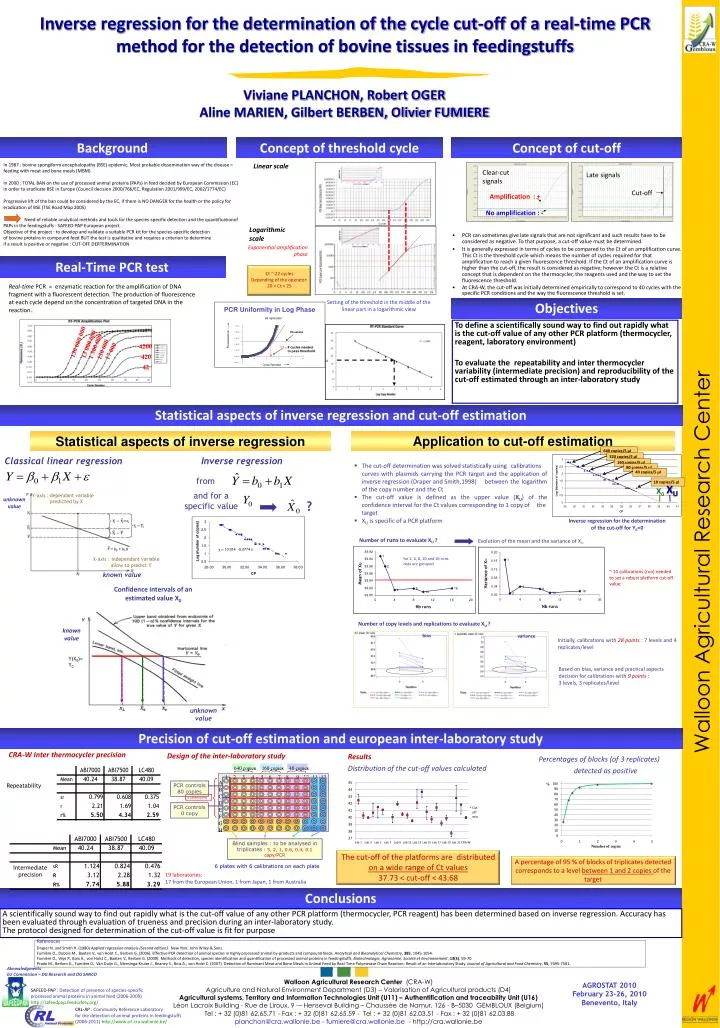
130 000 000 13 000 000 4200 Y(X0)=Y0 1 300 000 130 000 17 000 Amplification :+ 420 42 Intermediate precision No amplification : - for 2, 4, 8, 10 and 16 runsdata are grouped ~ 10 calibrations (run) needed to set a robust platform cut-offvalue bias variance Draper N. and Smith H. (1980) Applied regression analysis (Second edition). New York: John Wiley & Sons. Fumière O., Dubois M., Baeten V., von Holst C., Berben G. (2006). Effective PCR detection of animal species in highly processed animal by-products and compound feeds. Analytical and Bioanalytical Chemistry, 385, 1045-1054. Fumière O., Veys P., Boix A., von Holst C., Baeten V., Berben G. (2009). Methods of detection, species identification and quantification of processed animal proteins in feedingstuffs. Biotechnologie, Agronomie, Société et Environnement, 13(S), 59-70. Prado M., Berben G., Fumière O., Van Duijn G., Mensinga-Kruize J., Reaney S., Boix A., von Holst C. (2007). Detection of Ruminant Meat and Bone Meals in Animal Feed by Real-Time Polymerase Chain Reaction: Result of an Interlaboratory Study. Journal of Agricultural and Food Chemistry, 55, 7495-7501. Inverse regression for the determination of the cycle cut-off of a real-time PCR method for the detection of bovine tissues in feedingstuffs 320 copies/5 µl 160 copies/5 µl 80 copies/5 µl 40 copies/5 µl 640 copies 640 copies 160 copies 160 copies 40 copies 40 copies 10 copies/5 µl 1 1 2 2 3 3 4 4 5 5 6 6 7 7 8 8 9 9 10 10 11 11 12 12 Viviane PLANCHON, Robert OGER Aline MARIEN, Gilbert BERBEN, Olivier FUMIERE A A PCR controls 80 copies B B C C 6 calibrations D D PCR controls 0 copy E E F F Background Concept of threshold cycle Concept of cut-off G G H H In 1987 : bovine spongiform encephalopathy (BSE) epidemic. Most probable dissemination way of the disease = feeding with meat and bone meals (MBM) In 2000 : TOTAL BAN on the use of processed animal proteins (PAPs) in feed decided by European Commission (EC) in order to eradicate BSE in Europe (Council decision 2000/766/EC, Regulation 2001/999/EC, 2002/1774/EC) Progressive lift of the ban could be considered by the EC, if there is NO DANGER for the health or the policy for eradication of BSE (TSE Road Map 2005) Need of reliable analytical methods and tools for the species-specific detection and the quantificationof PAPs in the feedingstuffs : SAFEED-PAP European project. Objective of the project : to develop and validate a suitable PCR kit for the species-specific detectionof bovine proteins in compound feed BUT the test is qualitative and requires a criterion to determineif a result is positive or negative : CUT-OFF DERTERMINATION Linear scale Clear-cut signals Late signals Blind samples : to be analysed in triplicates : 5, 2, 1, 0.6, 0.4, 0.1 copy/PCR Cut-off Logarithmic scale • PCR can sometimes give late signals that are not significant and such results have to be considered as negative. To that purpose, a cut-off value must be determined. • It is generally expressed in terms of cycles to be compared to the Ct of an amplification curve. This Ct is the threshold cycle which means the number of cycles required for that amplification to reach a given fluorescence threshold. If the Ct of an amplification curve is higher than the cut-off, the result is considered as negative; however the Ct is a relative concept that is dependent on the thermocycler, the reagents used and the way to set the fluorescence threshold. • At CRA-W, the cut-off was initially determined empirically to correspond to 40 cycles with the specific PCR conditions and the way the fluorescence threshold is set. Exponential amplification phase Real-Time PCR test Ct ~ 22 cycles Depending of the operator: 20 < Ct < 25 Real-time PCR = enzymatic reaction for the amplification of DNA fragment with a fluorescent detection. The production of fluorescence at each cycle depend on the concentration of targeted DNA in the reaction. Setting of the threshold in the middle of the linear part in a logarithmic view Objectives To define a scientifically sound way to find out rapidly what is the cut-off value of any other PCR platform (thermocycler, reagent, laboratory environment) To evaluate the repeatability and inter thermocycler variability (intermediate precision) and reproducibility of the cut-off estimated through an inter-laboratory study Statistical aspects of inverse regression and cut-off estimation Application to cut-off estimation Statistical aspects of inverse regression 640 copies/5 µl Classical linear regression Inverse regression • The cut-off determination was solved statistically using calibrations curves with plasmids carrying the PCR target and the application of inverse regression (Draper and Smith,1998) between the logarithm of the copy number and the Ct • The cut-off value is defined as the upper value (XU) of the confidence interval for the Ct values corresponding to 1 copy of the target • XU is specific of a PCR platform from XU X0 and for a specific value Y-axis : dependant variable predicted by X unknown value ? Inverse regression for the determination of the cut-off for Y0=0 Number of runs to evaluate XU ? Evolution of the mean and the variance of XU X-axis : independant variable allow to predict Y known value Confidence intervals of an estimated value X0 Number of copy levels and replications to evaluate XU ? known value Initially, calibrations with 28 points : 7 levels and 4 replicates/level Based on bias, variance and practical aspectsdecision for calibrations with 9 points : 3 levels, 3 replicates/level unknown value Precision of cut-off estimation and european inter-laboratory study Design of the inter-laboratory study CRA-W Inter thermocycler precision Results Distribution of the cut-off values calculated Percentages of blocks (of 3 replicates) detected as positive Repeatability The cut-off of the platforms are distributed on a wide range of Ct values 37.73 < cut-off < 43.68 A percentage of 95 % of blocks of triplicates detected corresponds to a level between 1 and 2 copies of the target 6 plates with 6 calibrations on each plate 19 laboratories: 17 from the European Union, 1 from Japan, 1 from Australia Conclusions A scientifically sound way to find out rapidly what is the cut-off value of any other PCR platform (thermocycler, PCR reagent) has been determined based on inverse regression. Accuracy has been evaluated through evaluation of trueness and precision during an inter-laboratory study. The protocol designed for determination of the cut-off value is fit for purpose References Aknowledgments EU Commission – DG Research and DG SANCO AGROSTAT 2010 February 23-26, 2010 Benevento, Italy SAFEED-PAP : Detection of presence of species-specific processed animal proteins in animal feed (2006-2009) http://safeedpap.feedsafety.org/ CRL-AP : Community Reference Laboratory for the detection of animal proteins in feedingstuffs (2006-2011) http://www.crl.cra.wallonie.be/