Download
1 / 13
130 likes | 241 Views
Section 1-7: Analyzing and displaying data. Goal: Use statistical measures and data displays to represent data. Measures of Central Tendency. Mean – average, of n numbers the mean is the sum of the numbers divided by n

E N D
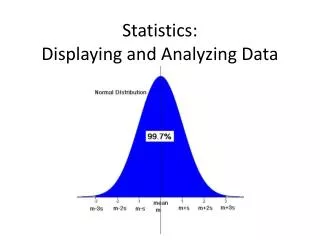
Section 1-7:Analyzing and displaying data Goal: Use statistical measures and data displays to represent data.
Measures of Central Tendency • Mean – average, of n numbers the mean is the sum of the numbers divided by n • Median – middle, of n numbers the median is the middle number when the numbers are written on order. If n is even, the median is the mean of the two middle numbers. • Mode – most frequent, of n numbers the mode is the number or numbers that occurs most frequently. There may be one mode, no modes, or more than one mode.
Example 1: Find the Measures of Central Tendency • Find the mean, median and mode(s) of the 30 team scores
Measures of Dispersion Range – difference between the greatest and least data values.
Example 2: Find the Ranges of Data Sets • Find the range of the Eastern and Western Conferences. • Range of Eastern Conference: • Range of Western Conference:
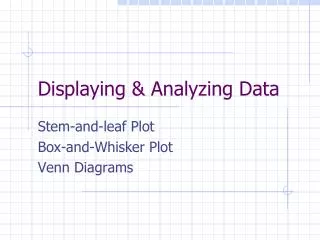
Box and Whisker Plots • Lower quartile – is the median of the lower half. • Upper quartile – is the median of the upper half.
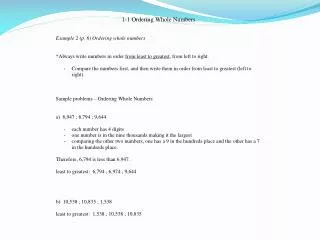
Example 3: Find the Lower and Upper Quartiles a. 10, 15, 17, 18, 20, 21 b. 31, 33, 33, 35, 36, 39, 40, 41, 41
Checkpoint: Find the Range, Median, and Lower and Upper Quartile • Find the range, median, lower quartile, and upper quartile for each set of data. • 11, 15, 16, 16, 17, 20, 24, 24, 24, 27, 29 • 47, 50, 51, 55, 55, 55, 57, 63, 66, 68, 68, 75
Example 4: Draw a Box and Whisker Plot • Draw a box and whisker plot of the Eastern Conference Data
Checkpoint: Draw a Box and Whisker Plot • Draw a box and whisker plot of the Western Conference Data
Homework: p. 49-50 10-42 even, 43-46