Download
1 / 16
160 likes | 306 Views
Increased hydroclimatic intensity with global warming. Filippo Giorgi Abdus Salam ICTP, Trieste, Italy. Open Science Conference, Denver, 24-28 October 2011. Contributors. F. Giorgi (ICTP, Italy) E.-S. Im (ICTP, Italy) E. Coppola (ICTP, Italy) N.S. Diffenbaugh (U. Stanford, USA)

E N D
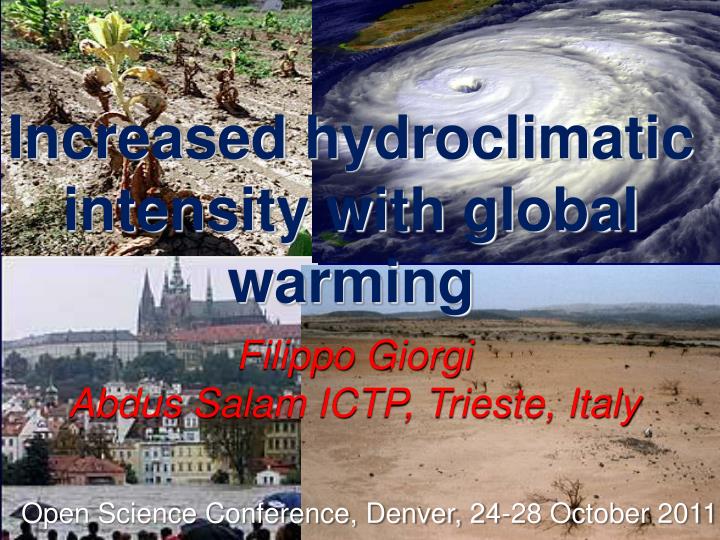
Increased hydroclimatic intensity with global warming FilippoGiorgi Abdus Salam ICTP, Trieste, Italy Open Science Conference, Denver, 24-28 October 2011
Contributors • F. Giorgi (ICTP, Italy) • E.-S. Im (ICTP, Italy) • E. Coppola (ICTP, Italy) • N.S. Diffenbaugh (U. Stanford, USA) • X.J. Gao (CMA, China) • L. Mariotti (ICTP, Italy) • Y. Shi (CMA, China) • Giorgi, F., E.S. Im, E. Coppola, N.S. Diffenbaugh, X.J. Gao, L. Mariotti, and Y. Shi, 2011: Higher hydroclimatic intensity with global warming. J. Climate, 24, 5309-5324.
Projected changes in precipitation characteristics IPCC (2007)
Observed trends in precipitation characteristics IPCC (2007) It rains less frequently but more intensely IPCC 2007: “More intense and longer droughts have been observed over wider areas since the 1970s” IPCC 2007: “The frequency of heavy precipitation events has increased over most land areas”
Hypothesis: The increases in dry day frequency and precipitation intensity are deeply interconnected and can be seen as a combined hydroclimatic signature of global warming Define an index of hydroclimatic intensity that combines precipitation intensity and dry spell length HY-INT = I • DSL I = Normalized Precipitation Intensity DSL = Normalized Dry Spell Length HY-INT is NOT an index of extremes HY-INT is calculated from daily precipitation on an annual basis
Alternate interpretation of HY-INT Fd = Ld • Nd, Fw = Lw • Nw HY-INT = 1/Nd • (P/Fw – P) HY-INT = P/Nw • Ld/Lw Fd(w) = Frequency of dry (wet) days Ld(w) = Average length of dry (wet) spells Nd(w) = Number of dry (wet) spells HY-INT is the average accumulated wet spell precipitation multiplied by the ratio of the average length of dry and wet spell
Examples of HY-INT for specific years in Europe
21st Century trend of HY-INT for three GCM projections, A1B Scenario ECHAM5
21st Century trend of HY-INT for three RCMs
Change of HY-INT within the context of changes in the global hydrologic cycle. ECHAM5 model, A1B scenario
Late 20th Century trend of HY-INT from station observations
Late 20th Century trend of HY-INT from station observations NCEP Reanalysis
Does the HY-INT response to global warming reflect an inherent behavior (regime shift) of the Earth’s hydrologic cycle? Colder Warmer
Conclusions • We introduce the HY-INT index as a measure of hydroclimatic intensity combining information of mean dry spell length and precipitation intensity and viewing the response of these variables to global warming as deeply interconnected • The increase in HY-INT appears to be a hydroclimatic signature of global warming in 21st century model projections and in observations for the late 20th century. • HY-INT can be used as a useful hydroclimatic detection and attribution tool • Understanding the HY-INT response to global warming can provide important physical insights into the behavior of the Earth’s hydrologic cycle • HY-INT can be useful as an assessment tool of hydroclimatic stress
Future work • HY-INT trend analysis in the next generation model projections • CMIP5 • CORDEX • Improved physical understanding of the HY-INT response to global warming • Application to detection/attribution studies • Implications for weather predictability?