Download
1 / 28
280 likes | 387 Views
International efforts in Climate Modeling Projections, Predictions and Downscaling Coordinated by the World Climate Research Program (WCRP) CMIP5: The 5th Coupled Model Intercomparison Project http://cmip-pcmdi.llnl.gov CORDEX: A Coordinated Regional Downscaling Experiment

E N D
International efforts in Climate Modeling Projections, Predictions and Downscaling Coordinated by the World Climate Research Program (WCRP) CMIP5: The 5th Coupled Model Intercomparison Project http://cmip-pcmdi.llnl.gov CORDEX: A Coordinated Regional Downscaling Experiment http://wcrp.ipsl.jussieu.fr/SF_RCMTerms.html Colin Jones Rossby Centre, SMHI Thanks to: Karl Taylor (PCMDI), Filippo Giorgi (ICTP), Ghassam Asrar (WCRP)
CMIP5 : a framework for climate change modeling for the next 5+ years • Promotes a standard set of model simulations in order to : • evaluate how realistic the models are in simulating the recent past • provide projections of future climate change on two time scales • understand factors responsible for model differences • Two timescales and two sets of science problems • An important input to IPCC AR5 • Taylor et al. 2009, http://cmip-pcmdi.llnl.gov/cmip5/ Long-Term : (1860 to 2100 & beyond) evaluation of climate models (e.g. new satellite data) detection & attribution climate change scenarios climate sensitivity, radiative forcing and physical feedbacks (e.g. clouds) biogeochemical feedbacks (e.g. carbon, chemistry) Near-Term : (next 1-30 years) decadal climate predictability ocean initialization aerosol impacts regional climate change (high resol) & climate extremes air quality changes (aerosols, chemistry)
CMIP5: Centennial Timescales: Earth System Modeling Aims to improve our ability to simulate all processes that influence the response of the climate system to increasing greenhouse gases • Cloud Feedbacks • Carbon-Climate Feedback (Ocean and Terrestrial) • Aerosol Feedbacks • Sea-Ice/Snow Feedbacks • Ocean circulation changes • Ice Sheets/Glacier response • Sea-level changes • Ocean acidification and ecosystem response • Permafrost and Methane Release To better constrain the lower and upper bounds of anthropogenic climate change requires (an accurate and complete) representation of complex and interacting process in Earth System Models
CMIP5: centennial projections • Start from a pre-industrial spin-up run (>500 yrs) • The 20th century control run includes observed changes in GHG, aerosol concentrations, volcanoes, and land-use from 1850-2005 • 3 RCP scenarios for the 21th century RCP8.5 20th century control RCP4.5 Spin-up RCP2.6 1850 1900 1950 2000 2050 2100 Possibly extend with more RCP scenarios, 1% CO2 increase, …
Decadal predictability and climate prediction • Predictability we are familiar with arises from an estimate • of future changes in GHG radiative forcing, and the climate • system response to those changes. • Predictability might also arise from information contained in the initial state of the system • - “committed warming” due to previous GHG forcing • - natural variability of the system Tom Delworth GFDL Assuming we can (i) observe this information (ii) assimilate it in our models,(iii) the variability has a predictable component and (iv) our models are good enough to simulate the subsequent evolution of the climate system We may be able to provide useful information about the evolution of the climate system on a ~1-20 year timescale. Climate Prediction as a mixed initial/boundary value problem
The Atlantic Meridional Oscillation index A 10-yr moving average of annual North Atlantic SST anomalies Linked to variability in the Atlantic Meridional Overturning Circulation crucial to simulate the time evolution of AMOC for decadal prediction
Global annual mean surface temp (TS) Global annual mean ocean heat content in upper 113m (H) There appears to be some increased skill (in a quantitative sense) when observations are included in coupled climate model predictions Results from the UK Met. Office DePreSys integrations D. Smith etal. UKMO
CMIP5: decadal prediction experiments 10 yrs +20 yrs • Start a 10-yr experiment every 5 years • Initialize from observation-based • re-analysis of atmosphere and ocean • Extend a few runs to 30 yrs 10 yrs 10 yrs 10 yrs • Decadal prediction still a research • topic: Targeted for ~1-20 year • Timescale : climate services ? • Hindcast simulations to • assess skill & uncertainty • Test ocean and sea-ice initialisation techniques • Interpretation of results not • easy (potential predictability) 10 yrs 10 yrs 10 yrs 10 yrs 10 yrs +20 yrs 10 yrs 10 yrs +20 yrs 1960 1970 1980 1990 2000 2010 2020
Decadal climate prediction is still in an exploratory stage It may be that much of the predictive skill for the coming decade (and beyond) will result from the “forced” GHG response not the initialized climate state. Results from “initialized” climate simulations often require (bias/drift) corrections: Application of these corrections is not trivial,there is danger of incorrect interpretation. For non-experts it may be safer & perhaps as informative to use output of the first few decades of the ‘long-term’ CMIP5 experiments (uncertainty issues will need to be addressed) In both cases an ensemble approach is an absolute necessity
CMIP5 output will be made available to everyone • Terms of use: • Alloutput available for educational and research use • Abouthalfof all output available for unrestricted use. • Extensive documentation will be available describing • the models and the experiment conditions. • Model data accessed via a federated Earth System Grid led by PCMDI connecting identical accessible/structured distributed archives across the world. • Actual location of model data invisible to the user
How will users access CMIP5 model output? ESG Data Providers (modeling groups) Node 1 Node 3 Node 5 Data Archive Node 2 Node 4 Model & expt. documentation Copy of heavily-used output ESG Gateway (PCMDI) DOI catalog Users (climate model analysts)
CORDEX A Coordinated Regional Downscaling Experiment Sponsored by the World Climate Research Programme http://wcrp.ipsl.jussieu.fr/SF_RCMTerms.html Generating an ensemble of high-resolution regional climate projections for the majority of land regions of the globe, based on a suitable sample of CMIP5 GCM projections. Strong orientation towards user needs: impacts and adaptation
General Aims and Plans for CORDEX Provide an ensemble of coordinated Regional Climate projections for 1950-2100 (core 1980-2050), for most land-regions of the globe based on CMIP5 simulations following RCPs 4.5, 8.5 and 2.6 Make this data available and useable to users, with a common diagnostic set and format (following CMIP5) at CORDEX archives Provide a framework for testing Regional Climate Models and Downscaling techniques for the recent past and future scenarios. Foster coordination between downscaling efforts around the world & encourage local participation in this process esp .developing nations With CMIP5 provide climate simulation data to support IPCC AR5 and impact-adaptation-vulnerability research on longer timescales International emphasis on African climate & impacts coming 2 years: START/WCRP analysis, training & capacity building activity 2011-12
Sampling the sources of uncertainty in RCD-based Regional climate projections RCD Configuration (Multiple models) AOGCM Configuration (Multiple AOGCMs) Uncertainty in regional climate projection Region Emission/ Concentration Scenarios Internal variability (Multiple realizations) RCD approach (Multiple RCD methods)
CORDEX Phase I experiment design Model Evaluation Framework Climate Projection Framework Multiple regions (Initial focus on Africa) 50km resolution (higher in some regions, Europe: 10km) ERA-Interim BC 1989-2008 RCP4.5, RCP8.5 some RCP 2.6 runs Multiple AOGCMs Regional Analysis Regional Databanks Europe, Korea, S.Africa Regional Projections 1950-2100
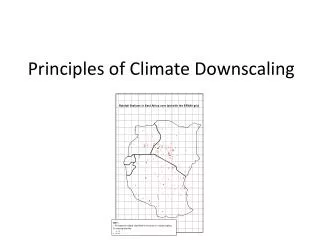
CORDEX DOMAINS (plus Arctic & Antarctica) •12 domains with a resolution of 0.44° (approx. 50x50km²) •Focus on Africa : 11 groups committed to run Africa projections •High resolution ~0.11°x0.11° for Europe (~6 institutions)
What has been decided in CORDEX • 6-hourly 3D model level fields will be saved by CMIP5 GCMs making climate projections as boundary forcing for RCMs • At least 1 RCP4.5 and 1 RCP8.5 member (1950-2100) per GCM. Many GCMs will also save an RCP2.6, plus > 1 RCP4.5 member • This data will become available on the CMIP5 data nodes in • May to October 2011 • The standard resolution is 50km(many groups plan to also run • higher resolution for selected domains, e.g. ~10km Europe ensemble) • 50km base resolution to include as many groups as possible 3.Before GCM forced runs for a given region RCMs must be run with ERA-interim (1989-2008) for the same region 4.An initial (international) focus for climate projections will be Africa with an aim to provide input to the IPCC AR5 process
Annual Cycle of West African Monsoon 5-day mean rainfall averaged between 10W to 10E
Health impact examples: Malaria Incidence over Africa: 2000-2008 Mean annual malaria Incidence (%) based on the Liverpool Malaria Model (LMM) for the period 2000-2008. The LMM has been driven by different observations (NCEP, ERAINTERIM and a hybrid run using GPCP rainfall and ERAINT temperatures) and one RCM from the CORDEX project (SMHI-RCA35, ERAINT control exp). The RCM fairly well reproduces the mean annual distribution of malaria incidence with respect to the GPCP-ERAINT run. . A.Morse U. Liverpool
Health impact examples: Malaria Prevalence over Africa: 2000-2008 Mean annual malaria Prevalence (%) based on the Liverpool Malaria Model (LMM) for 2000-2008. The LMM has been driven by different observations (NCEP, ERAINTERIM and a hybrid run using GPCP rainfall and ERAINT temperatures) and one RCM from the CORDEX project (SMHI-RCA35, ERAINT control exp). The RCM reproduces well the mean annual distribution of malaria prevalence with respect to the GPCP-ERAINT run (best estimate). . A.Morse U. Liverpool
Annual Cycle of Central African Rainfall Monthly mean rainfall averaged between 10E to 25E
Summary CMIP5 & CORDEX will deliver an unprecedented set of coordinated Global and Regional climate simulations over the coming ~1-4 years These data cover both the historical past, near-term predictions and a range of GHG/land-use scenario forced future projections CORDEX data will provide 50km (higher in some regions) ensembles of downscaled regional climate projections for most land regions of the world for use in impact-adaptation-vulnerability research CORDEX has developed regionally-specific, locally-led evaluation and analysis teams, with coupled capacity building and training activities e.g. Africa CORDEX WCRP/START training and analysis workshops. Both CMIP5 and CORDEX can provide important input to the evolving Climate Service sector for regions worldwide