Download
1 / 16
160 likes | 193 Views
Statistical vs Clinical or Practical Significance. Will G Hopkins Auckland University of Technology Auckland, NZ. Statistical significance P values and null hypotheses Confidence limits Precision of estimation Clinical or practical significance Probabilities of benefit and harm Examples.

E N D
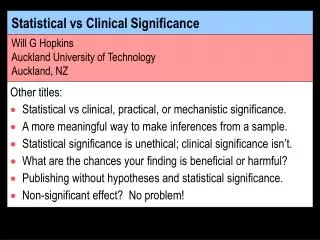
Statistical vs Clinical or Practical Significance Will G HopkinsAuckland University of TechnologyAuckland, NZ • Statistical significance • P values and null hypotheses • Confidence limits • Precision of estimation • Clinical or practical significance • Probabilities of benefit and harm • Examples
Background • Most researchers and students misinterpret statistical significance and non-significance. • Few people know the meaning of the P value that defines statistical significance. • Reviewers and editors reject some papers with statistically non-significant effects that should be published. • Use of confidence limits instead of a P value is only a partial solution to these problems. • What's missing is some way to convey the clinical or practical significance of an effect.
The Research Endeavor • Research is a quest for truth. • There are several research paradigms. • In biomedical and other empirical positivist research… • Truth is probabilistic. • We study a sample to get an observed value of a statistic representing an interesting effect, such as the relationship between physical activity and health or performance. • But we want the true (= population) value of the statistic. • The observed value and the variability in the sample allow us to make an inference about the true value. • Use of the P value and statistical significance is one approach to making such inferences. • Its use-by date was December 31, 1999. • There are better ways to make inferences.
Philosophy of Statistical Significance • We can disprove, but not prove, things. • Therefore, we need something to disprove. • Let's assume the true effect is zero: the null hypothesis. • If the value of the observed effect is unlikely under this assumption, we reject (disprove) the null hypothesis. • "Unlikely" is related to (but not equal to) a probability or P value. • P < 0.05 is regarded as unlikely enough to reject the null hypothesis (i.e., to conclude the effect is not zero). • We say the effect is statistically significant at the 0.05 or 5% level. • P > 0.05 means not enough evidence to reject the null. • We say the effect is statistically non-significant. • Some folks mistakenly accept the null and conclude "no effect".
Problems with this philosophy • We can disprove things only in pure mathematics, not in real life. • Failure to reject the null doesn't mean we have to accept the null. • In any case, true effects in real life are never zero. Never. • Therefore, to assume that effects are zero until disproved is illogical, and sometimes impractical or dangerous. • 0.05 is arbitrary. • The answer? We need better ways to represent the uncertainties of real life: • Better interpretation of the classical P value • More emphasis on (im)precision of estimation, through use of likely (= confidence) limits of the true value • Better types of P value, representing probabilities of clinical or practical benefit and harm
probability probability distributionof observed valueif true value = 0 P value =0.1 + 0.1 observedvalue 0 negative positive value of effect statistic Traditional Interpretation of the P Value • Example: P = 0.20 for an observed positive value of a statistic • If the true value is zero, there is a probability of 0.20 of observing a more extreme positive or negative value. • Problem: huh? (Hard to understand.) • Problem: everything that's wrong with statistical significance.
probability distributionof true value given the observed value probability (P value)/2= 0.10 observedvalue 0 negative positive value of effect statistic Better Interpretation of the P Value • For the same data, there is a probability of 0.10 (half the P value) that the true value is negative: • Easier to understand, and avoids statistical significance, but… • Problem: having to halve the P value is awkward, although could use one-tailed P values directly. • Problem: focus is still on zero or null value of the effect.
probability distributionof true value given the observed value Area = 0.95 probability observed value lower likely limit upper likely limit 0 negative positive value of effect statistic Confidence (or Likely) Limits of the True Value • These define a range within which the true value is likely to fall. • "Likely" is usually a probability of 0.95 (defining 95% limits). • Problem: 0.95 is arbitrary and gives an impression of imprecision. • 0.90, 0.68, or even 0.50 would be better… • Problem: still have to assess the upper and lower limits and the observed value in relation to clinically important values.
smallest clinicallyharmful value smallest clinicallybeneficial value observed value 0 negative positive value of effect statistic Clinical Significance • Statistical significance focuses on the null value of the effect. • More important is clinical significance defined by the smallest clinically beneficial and harmful values of the effect. • These values are usually equal and opposite in sign. • Example: • We now combine these values with the observed value to make a statement about clinical significance.
smallest clinicallybeneficial value probability Pbeneficial= 0.80 Ptrivial= 0.15 smallest clinicallyharmful value observed value Pharmful= 0.05 0 negative positive value of effect statistic • The smallest clinically beneficial and harmful values define probabilities that the true effect could be clinically beneficial, trivial, or harmful (Pbeneficial, Ptrivial, Pharmful). • These Ps make an effect easier to assess and (hopefully) to publish. • Warning: these Ps areNOT the proportions of+ ive, non- and - iveresponders in the population. • The calculations are easy. • Put the observed value, smallest beneficial/harmful value, andP value into the confidence-limits spreadsheet at newstats.org. • More challenging: choosing the smallest clinically important value, interpreting the probabilities, and publishing the work.
How to Report Clinical Significance of Outcomes • Examples for a minimum worthwhile change of 2.0 units. • Example 1–clinically beneficial, statistically non-significant(see previous slide; inappropriately rejected by editors): • The observed effect of the treatment was 6.0 units (90% likely limits –1.8 to 14 units; P = 0.20). • The chances that the true effect is practically beneficial/trivial/harmful are 80/15/5%. • Example 2–clinically beneficial, statistically significant(no problem with publishing): • The observed effect of the treatment was 3.3 units (90% likely limits 1.3 to 5.3 units; P = 0.007). • The chances that the true effect is practically beneficial/trivial/harmful are 87/13/0%.
Example 3–clinically unclear, statistically non-significant(the worst kind of outcome, due to small sample or large error of measurement; usually rejected, but could/should be published to contribute to a future meta-analysis): • The observed effect of the treatment was 2.7 units (90% likely limits –5.9 to 11 units; P = 0.60). • The chances that the true effect is practically beneficial/trivial/harmful are 55/26/18%. • Example 4–clinically unclear, statistically significant(good publishable study; true effect is on the borderline of beneficial): • The observed effect of the treatment was 1.9 units (90% likely limits 0.4 to 3.4 units; P = 0.04). • The chances that the true effect is practically beneficial/trivial/harmful are 46/54/0%.
Example 5–clinically trivial, statistically significant(publishable rare outcome that can arise from a large sample size; usually misinterpreted as a worthwhile effect): • The observed effect of the treatment was 1.1 units (90% likely limits 0.4 to 1.8 units; P = 0.007). • The chances that the true effect is practically beneficial/trivial/harmful are 1/99/0%. • Example 6–clinically trivial, statistically non-significant(publishable, but sometimes not submitted or accepted): • The observed effect of the treatment was 0.3 units (90% likely limits –1.7 to 2.3 units; P = 0.80). • The chances that the true effect is practically beneficial/trivial/harmful are 8/89/3%.
Probability Chances Odds The effect… beneficial/trivial/harmful <0.01 <1% <1:99 is not…, is almost certainly not… 0.01–0.05 1–5% 1:99–1:19 is very unlikely to be… 0.05–0.25 5–25% 1:19–1:3 is unlikely to be…, is probably not… 0.25–0.75 25–75% 1:3–3:1 is possibly (not)…, may (not) be… 0.75–0.95 75–95% 3:1–19:1 is likely to be…, is probably… 0.95–0.99 95–99% 19:1–99:1 is very likely to be… >0.99 >99% >99:1 is…, is almost certainly… Qualitative Interpretation of Probabilities • Need to describe outcomes in plain language. • Therefore need to describe probabilities that the effect is beneficial, trivial, and/or harmful. • Suggested schema:
Summary When you report your research… • Show the observed magnitude of the effect. • Attend to precision of estimation by showing likely limits of the true value. • Show the P value if you must, but do not test a null hypothesis and do not mention statistical significance. • Attend to clinical or practical significance by stating the smallest clinically beneficial and/or harmful value then showing the probabilities that the true effect is beneficial, trivial, and harmful. • Make a qualitative statement about the clinical or practical significance of the effect, using unlikely, very likely, and so on.
This presentation was downloaded from: A New View of Statistics newstats.org SUMMARIZING DATA GENERALIZING TO A POPULATION Simple & Effect Statistics Precision of Measurement Confidence Limits Statistical Models Dimension Reduction Sample-Size Estimation