Download
1 / 27
300 likes | 571 Views
Extreme value statistics. Problems of extrapolating to values we have no data about. unusually large or small. ~100 years (data). ~500 years (design). winds. Question: Can this be done at all?. How long will it stand?. Extreme value paradigm. is measured:.

E N D
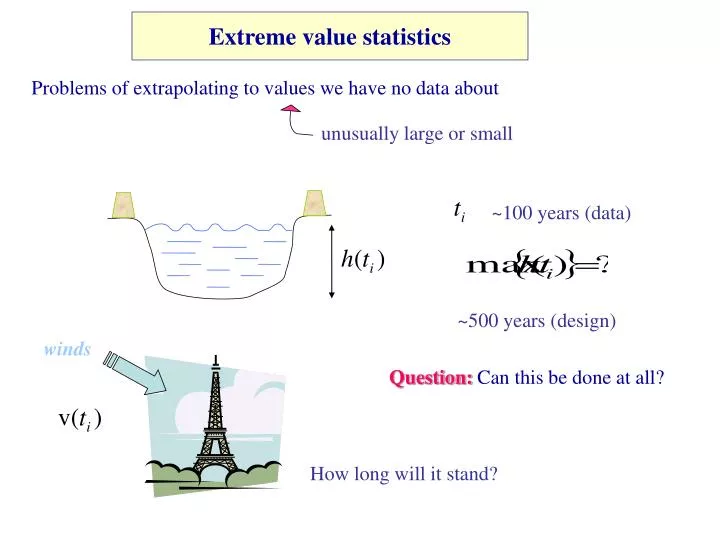
Extreme value statistics Problems of extrapolating to values we have no data about unusually large or small ~100 years (data) ~500 years (design) winds Question:Can this be done at all? How long will it stand?
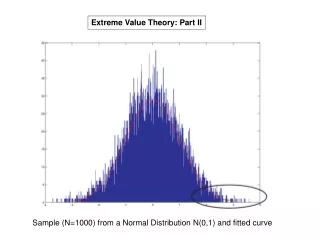
Extreme value paradigm is measured: Question: What is the distribution of the largest number? parent distribution Logics: Assume something about E.g. independent, identically distributed Use limit argument: Family of limit distributions (models) is obtained Calibrate the family of models by the measured values of
An example of extreme value statistics Data plotshere and below are from Stuart Coles: An Introduction to Statistical Modeling of Extreme Values The 1841 sea level benchmark (centre) on the `Isle of the Dead', Tasmania. According to Antarctic explorer, Capt. Sir James Clark Ross, it marked mean sea level in 1841. Recurrence time: If then the maximum will exceed in T years.
The weakest link problem 1.5cm F F 63 fibers F
Problem of trends I Variables may be non-identically distributed. Sea level seems to grow.
Problem of trends II Athletes run now faster than 30 years ago.
Problem of correlations I Maximum sea level depends, or at least is correlated to other variables.
Problem of correlations II Multivariate extremes
Homework: Carry out the above estimates for a Gaussian parent distribution ! Fisher-Tippett-Gumbel distribution I parent distribution is measured: Assumption: Independent, identically distributed random variables with 1st question:Can we estimate ? Note: 2nd question:Can we estimate ?
Expected thatthis resultdoes not depend on small details of . Fisher-Tippett-Gumbel distribution II parent distribution is measured: Assumption: Independent, identically distributed random variables with Question:Can we calculate ? Probability of : FTG density function
The scale of can be chosen at will. The shift in is not known! -1 largest smallest Fisher-Tippett-Gumbel distribution III is measured. We do not know the parent distribution! Important: In the simplest EVS paradigm only linear change of variables is allowed. Without this restriction any distribution could be obtained! Question: What is the „fitting to FTG” procedure? Fitting to: Asymptotes:
FTG function and fitting: Logscale See example on fitting.
Fisher-Tippett-Fréchet distribution I Parent distribution: Power decay is measured. 1st question:Can we estimate the typical maximum? 2nd question:Can we estimate the deviation? If it exists! The maximum is on the same scale as the deviation.
Fisher-Tippett-Fréchet distribution II is measured: Assumption: Independent, identically distributed random variables with parent Question:Can we calculate ? Probability of : For large : FTF density function
The origin and the scaleof x can be chosen at will: Fisher-Tippett-Fréchet distribution III in is not known! The function to fit for x>a is Note that for there is no average! The kth moment does not exist for
Finite cutoff: Weibull distribution I is measured: parent distribution Assumption: Independent, identically distributed random variables with 1st question:Can we estimate ? 2nd question:Can we estimate ?
Weibull distribution II is measured: parent distribution Assumption: Independent, identically distributed random variables with Question:Can we calculate ? Probability of : if if Weibull density function
Weibull distribution III is measured. parent distribution and possibly are not known! The scale of can be chosen at will. in is not known! Fitting to
Notes about the Tmax homework ? ? Find ? Introduce scaled variables common to all data sets ? ? ? Average and width of distribution ? so all data can be analyzed together. What kind of conclusions can be drawn? ?