Download
1 / 18
180 likes | 346 Views
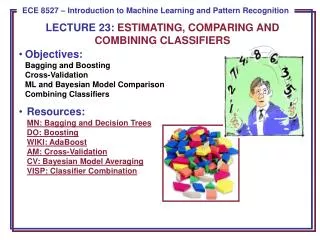
On Comparing Classifiers: Pitfalls to Avoid and a Recommended Approach. Author: Steven L. Salzberg Presented by: Zheng Liu. Introduction.

E N D
On Comparing Classifiers: Pitfalls to Avoid and a Recommended Approach Author: Steven L. Salzberg Presented by: Zheng Liu
Introduction • Data mining researchers often use classifiers to identify important classes of objects within a data repository. Classification is particularly useful when a database contains examples that can be used as the basis for future decision making; e.g., for assessing credit risks, for medical diagnosis, or for scientific data analysis. • Researchers have a range of different types of classification algorithms at their disposal, including nearest neighbor methods, decision tree induction, error back propagation, reinforcement learning, and rule learning.
Introduction • Problem: How does one choose which algorithm to use for a new problem? • This paper discusses some of the pitfalls that confront anyone trying to answer this question, and demonstrates how misleading results can easily follow from a lack of attention to methodology.
Definition • T-test: • The t-test assesses whether the means of two groups are statistically different from each other. • P-value: • It represents probability of concluding (incorrectly) that there is a difference in samples when no true difference exists. • Dependent upon the statistical test being performed. • P = 0.05 means that there is 5% chance that you would be wrong if concluding the populations are different. • NULL Hypothesis • Assumption that there is no difference in two or more populations.
Comparing algorithms • Classification research, which is a component of data mining as well as a subfield of machine learning, has always had a need for very specific, focused studies that compare algorithms carefully. • Based on [1], a high percentage of new algorithms (29%) were not evaluated on any real problem at all, and that very few (only 8%) were compared to more than one alternative on real data. [1]. Prechelt, L. A quantitative study of experimental evaluations of neural network learning algorithms: Current research practice. Neural Networks, 9, 1996.
Pitfalls • Classification research and data mining rely too heavily on stored repositories of data. • It is difficult to produce major new results using well-studied and widely shared data. • Easy studies need considerable skills. • Most comparative study does propose an entirely new method, most often it proposes changes to one or more known algorithms, and uses comparisons to show where and how the changes will improve performance. Although the goal is worthwhile, the approach is sometimes not valid.
Problem 1: Sharing a small repository of datasets • Suppose 100 people are studying the effect of algorithms A and B. • At least 5 will get results statistically significant at p <= 0.05 (assuming independent experiments). • These results are nothing but due to chance.
Problem 2: Statistics were not designed for computational experiments • Comparison of classifier algorithms • 154 datasets • NULL hypothesis is true if p-value < 0.05 (not very stringent) • Differences were reported significant if a t-test produced p-value < 0.05. • Actual p-value used is 154*0.05 (= 7.7).
Problem 2: Statistics were not designed for computational experiments • Let the significance for each level be • Chance for making right conclusion for one experiment is 1- • Assuming experiments are independent of one another, chance for getting n experiments correct is (1-)n • Chances of not making correct conclusion is 1-(1-)n • Substituting =0.05 • Chances for making incorrect conclusion is 0.9996 • To obtain results significant at 0.05 level with 154 tests 1-(1-)154 < 0.05 or < 0.003 • This adjustment is well known as BonferroniAdjustment .
Problem 3: Experiments are not independent • The t-test assumes that the test sets for each algorithm are independent. • When two algorithms are compared on the same data set, then obviously the test sets are not independent, since they will share some of the same examples—assuming the training and test sets are created by random partitioning, which is the standard practice. • The whole framework of using alpha levels and p-values has been questioned when more than two hypotheses are under consideration[2]. [2]. Raftery, A. Bayesian model selection in social research (with discussion by Andrew Gelman, Donald B. Rubin, and Robert M. Hauser). In Peter Marsden, editor, Sociological Methodology 1995, pages 111–196. Blackwells, Oxford, UK, 1995.
Problem 4: Only considers overall accuracy on a test set • Comparison must consider 4 numbers when a common test set to compare two algorithms (A and B) • A > B • A < B • A = B • ~A = ~B • If only two algorithms compared • Throw out ties. • Compare A>B Vs A<B • If more than two algorithms compared • Use “Analysis of Variance” (ANOVA) • Bonferroni adjustment for multiple test should be applied
Problem 5: Repeated tuning • Many researchers tune their algorithms repeatedly in order to make them perform optimally on some dataset. • The representation of the data, which may vary from one study to the next, even when the same basic dataset is used. • Whenever tuning takes place, every adjustment should really be considered as a separate experiment. • A greater problem occurs when one uses an algorithm that has been used before: the algorithm may already have been tuned on public databases.
Problem 5: Repeated tuning • The recommended procedure is to reserve a portion of the training set as a “tuning” set, and to repeatedly test the algorithm and adjust its parameters on the tuning set. When the parameters appear to be at their optimal settings, accuracy can finally be measured on the test data.
Problem 6: Generalizing results • A common methodological approach in recent comparative studies is to pick several datasets from the UCI repository (or other data source) and perform a series of experiments, measuring classification accuracy, learning rates, and perhaps other criteria. • It is not valid to make general statements about other datasets. The only way this might be valid would be if the UCI repository were known to represent a larger population of classification problems.
A recommended approach • Choose other algorithms to include in the comparison. Try including most similar to new algorithm. • Choose datasets. • Divide the data set into k subsets for cross validation. • Typically k=10. • For a small data set, choose larger k, since this leaves more examples in the training set.
A recommended approach • Run a cross-validation • For each of the k subsets of the data set D, create a training set T = D – k • Divide T into T1 (training) and T2 (tuning) subsets • Once tuning is done, rerun training on T • Finally measure accuracy on k • Overall accuracy is averaged across all k partitions. • compare algorithms • In case of multiple data sets, Bonferroni adjustment should be applied.
Conclusion • No single classification algorithm is the best for all problems. • Comparative studies typically include at least one new algorithm and several known methods; these studies must be very careful about their methods and their claims.
References [1]. Prechelt, L. A quantitative study of experimental evaluations of neural network learning algorithms: Current research practice. Neural Networks, 9, 1996. [2]. Raftery, A. Bayesian model selection in social research (with discussion by Andrew Gelman, Donald B. Rubin, and Robert M. Hauser). In Peter Marsden, editor, Sociological Methodology 1995, pages 111–196. Blackwells, Oxford, UK, 1995.