Download
1 / 10
100 likes | 198 Views
Juniorer. År Flickor Pojkar Totalt 2003 20761 73152 93913 2004 20992 71189 92811 2005 20139 65558 85697 2006 18988 60539 79527 2007 17464 55484 72948 2008 15679 50607 66286 2009 14274 46599 60873 Juniorandel = 12%. Utvecklingsmål. Andel juniorer till 20%

E N D
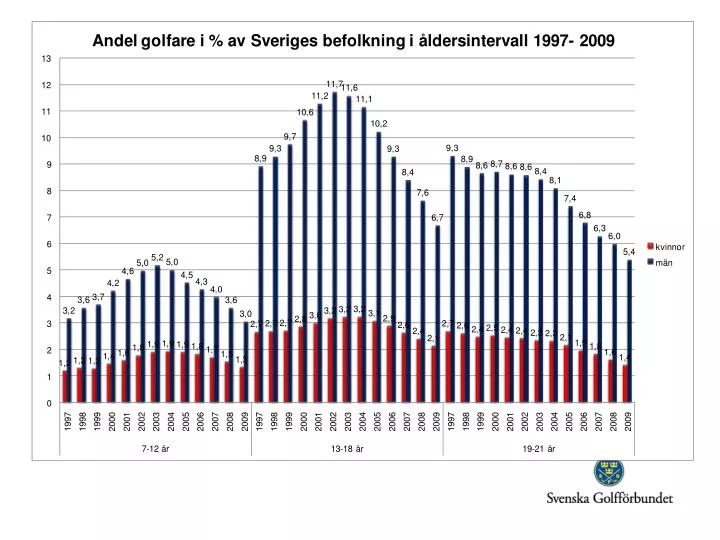
Juniorer År FlickorPojkarTotalt 2003 20761 73152 93913 2004 20992 71189 92811 2005 20139 65558 85697 2006 18988 60539 79527 2007 17464 55484 72948 2008 15679 50607 66286 2009 14274 46599 60873 Juniorandel = 12%
Utvecklingsmål • Andel juniorer till 20% • Antal spelare i Cupen till xx, % • Antal spelare med officiellt hcp, åldergrupp 13-18 år Flickor xx, % Pojkar xx, % • Antal juniorer med minst 10 tävlingsronder tillFlickor xx, % Pojkar xx, % • Antal juniorer (16-18 år) under hcp 5 till xx, % • Antal juniorer (13-15 år) under hcp 15 till xx, % • xx antal ledare som genomgår steg 1, 2 och 3