Download
1 / 24
260 likes | 611 Views
MAYR-MELNHOF KARTON AG. Mayr-Melnhof Group 1 st Half-Year 2003. Key figures. Karton. Packaging. Graphia. Group. SEGMENTS. the worldwide leading producer of recycled fiber based cartonboard (1.6 million tons)

E N D
MAYR-MELNHOF KARTON AG • Mayr-Melnhof Group • 1st Half-Year 2003
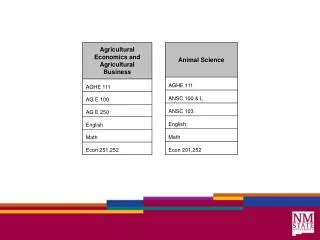
Key figures Karton Packaging Graphia Group SEGMENTS • the worldwide leading producer of recycled fiber based cartonboard (1.6 million tons) • Europe’s largest manufacturer of folding cartons (330,000 tons) • a leading European packaging producer for cigarettes and confectionery (85,000 tons)
Key figures Karton Packaging Graphia Group SITES MM-Karton 9 Mills in 6 countries MM-Packaging 15 Facilities in 7 countries MM-Graphia 5 Facilities in 2 countries Basis: 2003
Key figures Karton Packaging Graphia Group OVERVIEW 1st HALF-YEAR 2003 • Mayr-Melnhof remained strong also during 1st HY 2003 • Ongoing high-level earnings despite weak economic climate • As expected, market-related downtime at MM-Karton in Q2 followed high utilization in Q1 • Positive development of business in the folding carton • sector continued
Key figures Karton Packaging Graphia Group GROUP RESULTS 1st HALF-YEAR 2003 1st HY 2003 1st HY 2002 +/- Consolidated in EUR millions, US GAAP Sales 660.1 600.0 +10.0% 67.8 Operating profit 70.5 +4.0% 11.3% Operating margin 10.7% Net interest expense (0.7) (0.5) Other - net (3.2) 0.4 66.5 Income before taxes 68.1 -2.3% (26.3) (24.4) Income taxes -10.6% Net income 38.9 43.5 7.3% % of sales 5.9% Earnings per share (in EUR) 3.53 3.94 -2.6% Cash earnings 83.6 85.8 % of sales 12.7% 14.3%
Key figures Karton Packaging Graphia Group MM GROUP - QUARTERS
Key figures Karton Packaging Graphia Group SALES AND OPERATING PROFIT BY DIVISION PACKAGING PACKAGING CARTONBOARD CARTONBOARD 18% 62% 51% 31% GRAPHIA 20% 18% 56% GRAPHIA Sales Operating profit (1st HY / 2003)
Key figures Karton Packaging Graphia Group SALES BY REGION EU Eastern Europe 17% 70% 54% Asia 5% Others 5% 73% 56% (1st HY / 2003)
Key figures Karton Packaging Graphia Group GROUP BALANCE SHEET 31.12.2002 30.06.2003 Consolidated in EUR millions, US GAAP 518.2 535.3 Current assets 657.0 653.3 Non-current assets 1,175.2 1,188.6 Total assets 354.7 364.6 Current liabilities 240.2 228.2 Non-current liabilities 8.3 8.8 Minority interests 572.0 587.0 Stockholders‘ equity 1,175.2 1,188.6 Total liabilities and stockholders‘ equity Cash and cash equivalents + available-for-sale securities 231.7 225.5
Key figures Karton Packaging Graphia Group CONSOLIDATED STATEMENTS OF CASH FLOWS CONSOLIDATED STATEMENTS OF CASH FLOWS 1st HY 2003 1st HY 2002 2002 In EUR millions, US GAAP 68.7 Net cash provided by operating activities 70.9 173.8 (76.0) (50.0) (119.1) Net cash used in investing activities (32.8) (71.7) (46.3) Net cash used in financing activities (0.4) (1.1) (0.5) Exchange rate changes Net increase in cash and cash equivalents (13.0) (54.0) (17.5) Cash and cash equivalents at year-end 136.1 112.6 149.1 „Available-for-sale securities“ 95.6 76.4 79.2 Total resources available to the Group 191.8 231.7 225.5
Key figures Karton Packaging Graphia Group MAYR-MELNHOF KARTON
Key figures Karton Packaging Graphia Group MM-KARTON: 1st Half-Year 2003 • Average sales price fairly flat during 1st HY 03 and above 1st HY 02 level • Capacity utilization 1st HY 03: 88 % (1st HY 02: 98 %) • Apart from a short-term hike in the waste paper price at the • beginning of Q2 raw material prices remained almost unchanged
Key figures Karton Packaging Graphia Group MM-KARTON: 1st Half-Year 2003 Q1/2003 Q2/2003 +/- 1st HY 2003 1st HY 2002 In EUR millions, US GAAP 385.4 396.7 Sales 203.4 182.0 -2.8% 43.7 50.1 17.8 Operating profit 25.9 -12.8% 11.3% 12.6% 9.8% Operating margin 12.7% 716 742 343 373 -3.5% Tonnage produced in 000‘s of tons
Key figures Karton Packaging Graphia Group MM-KARTON - QUARTERS
- 3.5 % Key figures Karton Packaging Graphia Group CARTONBOARD SOLD Tons 22% 19% 15% 17% 13% 78% 85% 81% 17% 83% 23% 87% 30% 25% 83% 21% 70% 77% 20% 75% 79% 80%
Key figures Karton Packaging Graphia Group MAYR-MELNHOF PACKAGING
Key figures Karton Packaging Graphia Group MMP – SPEZIALIZATION FOOD DETERGENTS PET FOOD MICROFLUTE PHARMA MULTIPACK
Key figures Karton Packaging Graphia Group MAYR-MELNHOF GRAPHIA
Key figures Karton Packaging Graphia Group CIGARETTE PACKAGING
Key figures Karton Packaging Graphia Group HIGH-GRADE CONFECTIONERY PACKAGING
Key figures Karton Packaging Graphia Group MM-PACKAGING / MM-GRAPHIA: 1stHY 2003 • Positive development of business continued • Market position strengthened • Relatively stable demand due to products very close to consumption • MM-Packaging:Successful cost management and new customers • MM-Graphia:- Integration was terminated in Q1 • - Stable development of sales in cigarette as well as • confectionary packaging • - Success expansion on Eastern European markets
Key figures Karton Packaging Graphia Group MM-PACKAGING: 1st Half-Year 2003 Q1/2003 Q2/2003 1st HY 2003 In EUR millions, US GAAP 200.2 Sales 101.9 98.3 12.4 6.7 Operating profit 5.7 6.2% 6.8% Operating margin 5.6% 153 74 79 Tonnage converted in 000‘s of tons
Key figures Karton Packaging Graphia Group MM-GRAPHIA: 1st HALF-YEAR 2003 Q1/2003 Q2/2003 1st HY 2003 In EUR millions, US GAAP 121.9 Sales 58.9 63.0 14.4 6.6 Operating profit 7.8 11.8% 10.5% Operating margin 13.2% 45 22 23 Tonnage converted in 000‘s of tons
Key figures Karton Packaging Graphia Group OUTLOOK • Forecast horizon still extremely short-term • Positive development at MM-Packaging and MM-Graphia • should also continue in the 3rd quarter • Cartonboard business to remain short-term • As in the past, MM-Karton will adjust production to market conditions • by taking selective downtime. • (satisfactory development in July expected to be followed by capacity utilization • exceeding Q2 level (83 %) also in the month of August) • The target of keeping prices will be maintained • Stability on waste paper marketsin line with current assumption on demand • Stay confident for the overall 2003 financial year