Download
1 / 10
250 likes | 1.43k Views
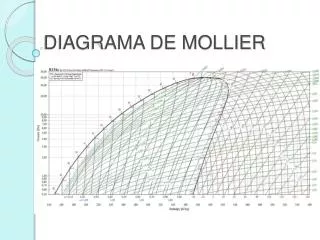
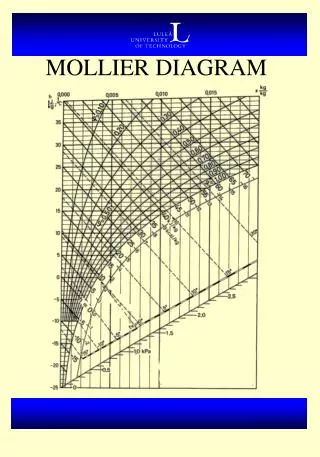
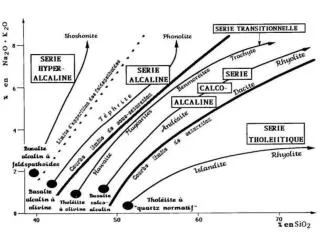
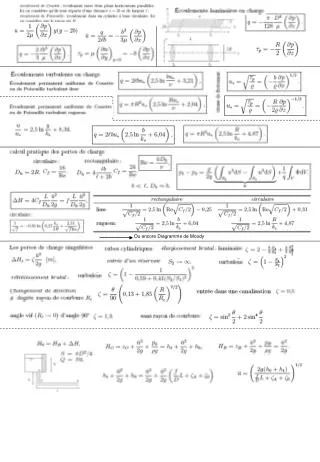
Construction du diagramme de MOLLIER. Lecture du graphe Construction du diagramme. Isotherme 10°c. Lecture du graphe. Lecture du graphe. Isobare 1 bar. Lecture du graphe. Isenthalpe 200kj/kg. Lecture du graphe. Iso titre 40% à l’état gazeux, 60% à l’état liquide. 100% à l’état liquide.

E N D
Construction du diagramme de MOLLIER Lecture du graphe Construction du diagramme
Isotherme 10°c Lecture du graphe
Lecture du graphe Isobare 1 bar
Lecture du graphe Isenthalpe 200kj/kg
Lecture du graphe Iso titre 40% à l’état gazeux, 60% à l’état liquide
100% à l’état liquide Lecture du graphe 100% à l’état gazeux
+75°c 456kj/kg 12 bar Lecture du graphe 100% gazeux
Construction du diagramme de MOLLIER d’un congélateur • A-Sortie évaporateur entrée compresseur 8°c 0,9 bar 410kJ/kg 100% gazeux • B-Sortie compresseur entrée condenseur 75°c 12 bar 456kj/kg 100% gazeux • C-Sortie condenseur entrée capillaire 8°c 12 bar 207kj/kg 100% liquide • D-Sortie capillaire entrée évaporateur -30°c 0,9 bar 207kJ/kg 20% gazeux
C Construction du diagramme B D A W Qv Qc