Download
1 / 16
170 likes | 398 Views
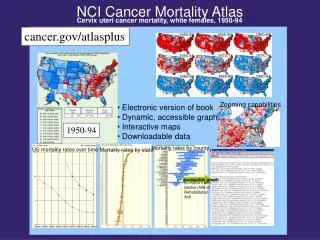
Cancer Statistics, NCI 2004. Department of Biostatistics & Epidemiology NCI Egypt December 2005. National Cancer Institute, Cairo, Egypt. The National Cancer Institute (NCI) is the largest comprehensive cancer center in Egypt

E N D
Cancer Statistics, NCI 2004 Department of Biostatistics & Epidemiology NCI Egypt December 2005
National Cancer Institute, Cairo, Egypt • The National Cancer Institute (NCI) is the largest comprehensive cancer center in Egypt • The present hospital with its 550 beds is overloaded by patients referred from allover the country • The NCI for years had a well established Pathology-Based and an Inpatient-Based Cancer Registries • Our first attempt towards a Hospital-Based Cancer Registry was in the year 2001
National Cancer Institute, Cairo, Egypt,Results Overview • Over a 33 year period (1970 – 2003) more than 300,000 new patients visited the NCI, & in excess of one million outpatient visits. • In the year 2004 there were: • 19,210 new patients seen at the NCI • 14,000 hospital admissions • Approximately 170,000 outpatient visits. • 65% of patients came from the Greater Cairo area, 16% from lower Egypt, & 20% from upper Egypt. • 48 % of cases were males • Approximately 87% of patients are treated free of charge
2002 2003 2004 Total 19,405 19,069 19,210 Malignant Proven 46.5% 48.1% 48.3% Under investigation 17.7% 19.5% 15.6% Non malignant 35.4% 31.8% 35.0% Borderline 0.4% 0.6% 0.9% Confirmation of Malignancy among New Patients (2002-04)
2002 2003 2004 Histopathologic 7,168 (79.5%) 7,287 (79.5%) 6,901 (78.7%) Non-histopathologic 1,855 (20.6%) 1,879 (20.5%) 1,895 (21.3%) Basis of Diagnosis of New Cancer Cases (2002-2004)
9,314 New Cancer Cases by Age Groups & Gender 47 63 53 50
Childhood Cancer, NCI 2004Pediatrics & Adolescents In the year 2004, 862 (9.3%) of the new cases were age less than 20 years
306 (35.5%) New Cases of Leukemia among Children Boys n=184 Girls n=122
138 (16%) New Cases of Lymphoma among Children Boys n=97 Girls n=41