Download
1 / 30
310 likes | 373 Views
Voronoi-based Geospatial Query Processing with MapReduce. Afsin Akdogan , Ugur Demiryurek , Farnoush Banaei-Kashani and Cyrus Shahabi University of Southern California. 12/02/2011 IBM Student Workshop for Frontiers of Cloud Computing. Outline. Motivation Related Work Preliminaries

E N D
Voronoi-based Geospatial Query Processing with MapReduce AfsinAkdogan, UgurDemiryurek, FarnoushBanaei-Kashani and Cyrus Shahabi University of Southern California 12/02/2011 • IBM Student Workshop for Frontiers of Cloud Computing
Outline • Motivation • Related Work • Preliminaries • Voronoi Diagram (Index) Creation • Query Types • Performance Evaluation • Conclusion and Future Work
Motivation • Applications of geospatial queries: • GIS, Decision support systems, Bioinformatics, etc. • Size of geo-tagged data rapidly grows. • Advances in location-based services. Ex: gps devices, facebook check-in, twitter, etc.
Motivation • Geospatial queries on Cloud… • Big data • Geospatial queries are intrinsically parallelizable
Motivation • Problem: Find nearest neighbor of every point. Split 1 Split 2 p1 p2 • Naïve Solution: Calculate a distance value from p1 to every other point in the map step and find the minimum in the reduce step. • Large intermediate result.
Related Work • Centralized Systems • M. Sharifzadeh and C. Shahabi. VoRTree: Rtrees with Voronoi Diagrams for Efficient Processing of Spatial Nearest Neighbor Queries. VLDB, 2010. • Parallel and Distributed Systems • Parallel Databases • J.M. Patel. Building a Scalable Geospatial Database System. SIGMOD, 1997. • Distributed Systems • C. Mouza, W. Litwin and P. Rigaux. SD-Rtree: A Scalable Distributed Rtree. ICDE, 2007. • Cloud Platforms • A. Cary, Z. Sun, V. Hristidis and N. Rishe. Experiences on Processing Spatial Data with MapReduce. SSDBM, 2009.
Our Approach • MapReduce-based. Points are in 2D Euclidean space. • Data are indexed with Voronoi diagrams. • Both Index creation and query processing are done with MapReduce. • 3 types of queries: • Reverse Nearest Neighbor. • Maximizing Reverse Nearest Neighbor (First implementation on a non-centralized system). • K-Nearest Neighbor Query.
Outline • Motivation • Related Work • Preliminaries • Voronoi Diagram (Index) Creation • Query Types • Performance Evaluation • Conclusion and Future Work
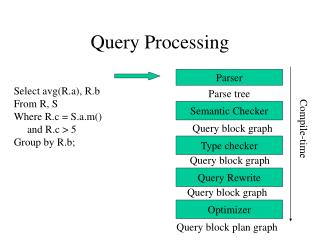
Preliminaries: MapReduce • Map(k1,v1) -> list(k2,v2) • Reduce(k2, list (v2)) -> list(v3)
Preliminaries: Voronoi Diagrams • Given a set of spatial objects, a Voronoi diagram uniquely partitions the space into disjoint regions (cells). • The region including object p includes all locations which are closer to p than to any other object p’. Ordinary Voronoi diagram Dataset: Points Distance D(.,.): Euclidean Voronoi Cell of p
Preliminaries: Voronoi Diagrams • A point cannot have more than 6 Voronoi neighbors on average. Limited search space! Ordinary Voronoi diagram Dataset: Points Distance D(.,.): Euclidean Voronoi Cell of p
Preliminaries: Voronoi Diagrams • Nearest Neighbor of p is among its Voronoi neighbors (VN). VN(p) = {p1, p2, p3, p4, p5, p6} p6 p1 p5 p2 p4 p3
Preliminaries: Voronoi Diagrams • Nearest Neighbor of p is among its Voronoi neighbors (VN). VN(p) = {p1, p2, p3, p4, p5, p6} p6 p1 p5 p2 p4 p3
Preliminaries: Voronoi Diagrams • Nearest Neighbor of p is among its Voronoi neighbors (VN). VN(p) = {p1, p2, p3, p4, p5, p6} p5 is p’s nearest neighbor. p6 p1 p5 p2 p4 p3
Outline • Motivation • Related Work • Preliminaries • Voronoi Diagram (Index) Creation • Query Types • Performance Evaluation • Conclusion and Future Work
Voronoi Generation: Map phase Generate Partial Voronoi Diagrams (PVD) Split 1 Split 2 right left p7 p1 p3 p5 p8 p4 p2 p6 right left emit emit <key, value>: <1, PVD(Split 1)> <key, value>: <1, PVD(Split 2)>
Voronoi Generation: Reduce phase Remove superfluous edges and generate new edges. Split 1 Split 2 right left p7 p1 p3 p5 p8 p4 p2 p6 right left emit <key, value>: <point, Voronoi Neighbors> <p1, {p2, p3}> <p2, {p1, p3, p4}> <p3, {p1, p2, p4, p5}> …..
Query Type 1: Reverse Nearest Neighbor • Given a query point q, Reverse Nearest Neighbor Query finds all points that have q as their nearest neighbors. • NN(p1) = p2 • NN(p2) = p5 • NN(p3) = p5 • NN(p4) = p5 • NN(p5) = p3 • Reverse Nearest Neighbors of p5: {p2, p3, p4} p2 p3 p5 p1 p4
Query Type 1: Reverse Nearest Neighbor • How does Voronoi Diagram help? • Find Nearest Neighbor of a point p Without Voronoi Diagrams: p2 • Calculate a distance value from p to every other point in the map step and find the minimum in the reduce step. p3 p5 p1 p4 • Large intermediate result.
Query Type 1: Reverse Nearest Neighbor • Map Phase: • Input: <point, Voronoi Neighbors> • Each point p finds its Nearest Neighbor • Emit: <NN(pn), pn> • Ex: <p5, p2> <p5, p3> <p5, p4> • Reduce Phase: • <point, Reverse Nearest Neighbors> • Ex: <p5, {p2, p3, p4}> p2 p3 p5 p1 p4
Query Type 2: MaxRNN • Motivation behind parallelization: • It requires to process a large dataset in its entirety that may result in an unreasonable response time. • In a recent study, it has been showed that the computation of MaxRNN takes several hours for large datasets.
Query Type 2: MaxRNN • Locates the optimal region A such that when a new point p is inserted in A, the number of Reverse Nearest Neighbors for p is maximized. Known as the optimal location problem. D A C Region B is maximizing the number of Reverse Nearest Neighbors B p1 p2
Query Type 2: MaxRNN • The optimal region can be represented with intersection points that have been overlapped by the highest number of circles. p1 p2 p3 Intersection point
Query Type 2: MaxRNN • 2 step Map/Reduce Solution • 1. step finds the NN of every point and computes the radiuses of the circles. • 2. step finds the overlapping circles first. Then, it finds the intersection points that represent the optimal region. • Runs several times.
Outline • Motivation • Related Work • Preliminaries • Voronoi Diagram (Index) Creation • Query Types • Performance Evaluation • Conclusion and Future Work
Performance Evaluation • Real-World Navteq datasets: • BSN: all businesses in the entire U.S., containing approximately 1,300,000 data points. • RES: all restaurants in the entire U.S., containing approximately 450,000 data points. • Hadoop on Amazon EC2 • Evaluated our approach based on • Index Generation • Query Response times • Replication factor = 1
Performance Evaluation • Voronoi Index • Competitor approach: MapReduce based Rtree • RTree generation is faster than Voronoi. • Voronoi is better in Query Response times (Ex: Reverse Nearest Neighbor) • Nearest Neighbor of every point
Performance Evaluation • MaxRNN • First implementation on a non-centralized system. • Evaluated the performance for 2 different datasets.
Conclusion and Future Work • Conclusion • Geospatial Queries are parallelizable. • Indexing (Voronoi Diagram) significantly improves the performance. • Ongoing Work • Scalable Distributed Index Structure for spatial data.