Download
1 / 38
380 likes | 454 Views
Understanding Premium Tax Credits and Cost-Sharing Reductions. Jon Peacock, Wisconsin Council on Children and Families Judy Solomon, Center on Budget and Policy Priorities Joe Touschner, Georgetown University Center for Children and Families. Agenda. Coverage overview Premium tax credits

E N D
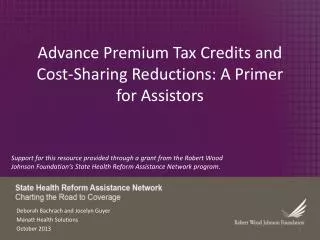
Understanding Premium Tax Credits and Cost-Sharing Reductions Jon Peacock, Wisconsin Council on Children and Families Judy Solomon, Center on Budget and Policy Priorities Joe Touschner, Georgetown University Center for Children and Families
Agenda • Coverage overview • Premium tax credits • Eligibility • Amount • Cost-sharing • Actuarial value • Cost-sharing reductions
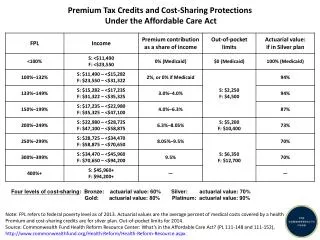
Coverage Landscape in 2014 FPL Unsubsidized 400% 300% Subsidized 235% 185% 200% 133% 100% 61% 37% Medicaid / CHIP 0% Pregnant Women Childless Adults Children Working Parents Jobless Parents Medicaid and CHIP coverage, based on 2012 eligibility levels in a typical state Source: Kaiser Commission on Medicaid and the Uninsured
Coverage sources by share of children Source: Genevieve M. Kenney, et al., Improving Coverage For Children Under Health Reform Will Require Maintaining Current Eligibility Standards For Medicaid And CHIP, Health Affairs, December 2011.
What Kind of Coverage Can People Buy? Higher premiums, lower enrollee cost-sharing Benchmark Lower premiums, higher enrollee cost-sharing
Two Types of Subsidies • Premium Tax Credits • Help people pay the monthly cost to have a plan • Cost-Sharing Reductions • Decrease the charges enrollees must pay when receiving health care services covered by the plan
Who Is Eligible for Premium Tax Credits? • Individuals and families with income between 100% to 400% FPL • Must be US citizens or lawfully present in the US • Must not be eligible for other “minimum essential coverage” • Lawfully residing immigrants with incomes below 100% FPL who are not eligible for Medicaid because of their immigration status
Premium Tax Credits & Employer Coverage • An individual is not eligible for premium tax credits if he is eligible for other minimum essential coverage(MEC) • Most employer-sponsored coverage is MEC • An offer of coverage – even if it’s not taken – can make someone ineligible for premium tax credits • Exception: an individual may be eligible for premium tax credits if the employer plan is unaffordable or inadequate and if the employee does not enroll in it
Jumping the “Firewall” Between Employer Coverage and Premium Tax Credits Premium Tax Credits If unaffordable or inadequate Offer of Employer Coverage
Jumping the Firewall: When is Employer Coverage Affordable? • Coverage is considered affordable if employee contribution for self-only coverage is less than 9.5% of household income • Employee contribution for self-only coverage is used to determine affordability for both employee and dependents
Affordability of Family Coverage (Reyes Family) Mom works at Acme. She earns $35,000. Dad is an entrepreneur and earns about $12,000. Family Income: $47,000 Premium Cost to Employee for Employee-Only Plan: $196/mo ($2,350/yr) 5% of income Premium Cost to Employee for Family Plan: $509/mo ($6,110/yr) 13% of income Bottom Line: No one is eligible for premium tax credits because family coverage is considered affordable. 9.5%
Jumping the Firewall:When is Coverage Adequate? • Coverage is adequate if it has a minimum value (MV) of 60% • This generally means that the plan pays at least 60% of spending for coverage of essential health benefits for a typical population, after accounting for cost-sharing charges required under the plan
How Will an Employee Know if his Offer is Affordable or Adequate? • Application has an appendix to be completed by the applicant (with help from his employer) to indicate value and cost of the plan
How Is the Amount of the Tax Credit Determined? Credit amount affected by: • Individual or family’s expected contribution based on their income • Premium cost for benchmark plan Credit amount = Cost of benchmark plan – Expected premium contribution
What Is the Benchmark Plan? How Is it Determined? • Second lowest cost silver plan available to each eligible household member • When no one plan covers every member, may be based on one or more policies
What Is the Benchmark Plan? Effect of Pediatric Dental Benefits • Benchmark is not adjusted based on whether it includes pediatric dental benefits • So the benchmark and PTC amount won’t rise when a family purchases a stand alone dental plan • Unless the family buys a plan less expensive than the benchmark. Then there is ‘left over’ credit to apply to the stand alone dental plan.
Example: Family of Four (Reyes Family) Income: $52,988 (225% FPL) Expected contribution: 7.18% or $3,802 • 3 Lowest Cost Silver Plans that Cover Entire Family: • Plan A: $14,800 • Plan B: $15,000 • Plan C: $15,200 Benchmark Could be one or multiple policies Premium Credit: $15,000 - $3,802 = $11,198
Example: Household with Ineligible Members • Reyes Family: • Same income • In a state with CHIP up to 250% FPL • Mom and dad purchase coverage, kids on CHIP • 3 Lowest Cost Silver Plans Covering Mom and Dad • Plan A: $9,800 • Plan B: $10,000 • Plan C: $10,200 • Premium Credit: • $10,000 – 3,802 = $6,198 Benchmark
Example: Household with Members Residing in Different Locations • Reyes Family: • Same income • All members eligible • Son goes to college in a different part of the state • 3 Lowest Cost Silver Plans: • Mom, Dad, and Daughter • Plan A: $12,300 • Plan B: $12,500 • Plan C: $12,800 • Premium Credit: • $12,500 + $3,000 – 3,802 = $11,698 • Son • Plan A: $2,800 • Plan B: $3,000 • Plan C: $3,200 Benchmark
Comparing Three Reyes Family Scenarios Income: $52,988 (225% FPL) Expected contribution: 7.18% or $3,802 Key takeaway: Applicable benchmark plan affects credit amount but not expected contribution
How Do Rating Factors Affect the Cost of the Benchmark Plan? • Age • Limited to no more than 3 to 1 variation • Each family member rated separately • Family size • Total premium for family = Sum of premiums for each family member • Exception: In families with > 3 members under 21, count only 3 oldest children • Geographic area
What Factors Affect What FamiliesWill Actually Pay for Coverage? • Tobacco use • Difference due to tobacco use not accounted for in affordability determination OR premium credit calculation • Plan chosen by consumer • Amount of credit pegged to second lowest cost silver plan • But consumer can purchase any metal plan • Other premium obligations • For example, CHIP premiums
How Do People Get Premium Credits? • Submit application to the Marketplace for advance payment of credits • Marketplace estimates amount of advance payment based on projected income • Credit is sent directly to insurer, individual pays insurer balance of premium • Can also wait until tax filing and claim on return • Credits are refundable
What Happens When Estimated Income for the Year is Different from Actual Income? • Final amount of credit based on actualincome • At tax filing time, advance payments received are reconciled with actual credit amount • If income increases, may have to repay • If income decreases, may get more credit at tax time • To avoid repayment, can reduce the amount of advance payment received during the year
Cost-Sharing Standards for All Marketplace Plans • Protect enrollees from very high out-of-pocket costs for covered, in-network benefits • Help organize plans to make them easier for people to compare • Maximum Out-of-Pocket Limit • 2014 amounts: $6,350 individual/$12,700 family • OOP limit is not the amount that an enrollee must spend each year
What is Actuarial Value? • A way to estimate and compare the overall generosity of plans • Expressed as a percentage • Tells you what percentage of a typical population’s costs for covered services the plan would pay for • Does not represent what the plan would pay for any particular individual
What Actuarial Value Does and Does Not Do • AVs under the health law focus on cost-sharing • Not what benefits are covered, limits on # of visits, or what drugs are covered • Not the provider network • Don’t tell you what any particular enrollee will pay for health care services • Enrollee out-of-pocket costs depend on the medical care a person uses
Example: What Jane Pays in Different Levels of Coverage Bronze $5,150 Silver $4,190 Gold $2,675 Platinum $845 Jane’s out-of-pocket costs
What are Cost-Sharing Reductions? • A federal benefit that reduces the out-of-pocket charges an enrollee must pay for medical care covered by the plan • 3 levels of cost-sharing reductions based on income • Available January 1, 2014
Who is Eligible for Cost-Sharing Reductions? • People with income up to 250% FPL • Must enroll in a silver plan through the Health Insurance Marketplace (also called the exchange)
How are Cost-Sharing Reductions Provided? • Enrollee cost sharing charges are automatically reduced when an eligible person or family enrolls in a silver plan • People do not have to keep track of their spending or get reimbursed • Not provided as a tax credit • Not “reconciled” at the end of the year • Federal government pays the health insurer upfront
John: Example 1: Silver Plan Total Premium: $5,000 John’s Premium Contribution: $121/month Plan AV with CSR: 87% Example 2: Bronze Plan Total Premium: $3,000 John’s Premium Contribution: $0 / month Plan AV without CSR: 60% Age: 24 Premium Credit: $3,552 Income: $22,980
John: Example 1: Silver Plan Total Premium: $5,000 John’s Premium Contribution: $121/month Plan AV with CSR: 87% Example 2: Gold Plan Total Premium: $6,000 John’s Premium Contribution: $204/month Plan AV without CSR: 80% Age: 24 Premium Credit: $3,552 Income: $22,980
Key Considerations in Plan Selection • What health care expenses are likely • Upfront cost-sharing (the deductible), “as-you-go” cost-sharing (like copayments) • Other aspects of the plan, such as provider network and covered drugs • What benefits are covered under various plans (may vary depending on state)
Questions? • Judy Solomon • solomon@cbpp.org • Joe Touschner • jdt38@georgetown.edu • Jon Peacock • jpeacock@wccf.org