Download
1 / 1
10 likes | 152 Views
Photonic Crystal Multi-Mode Spectrometers Duke University, The Fitzpatrick Center for Photonics and Communications Systems. Adam J. Saltzman, Scott T. McCain, Mike E. Sullivan and David J. Brady UNC Charlotte , Department of Physics and Optical Science

E N D
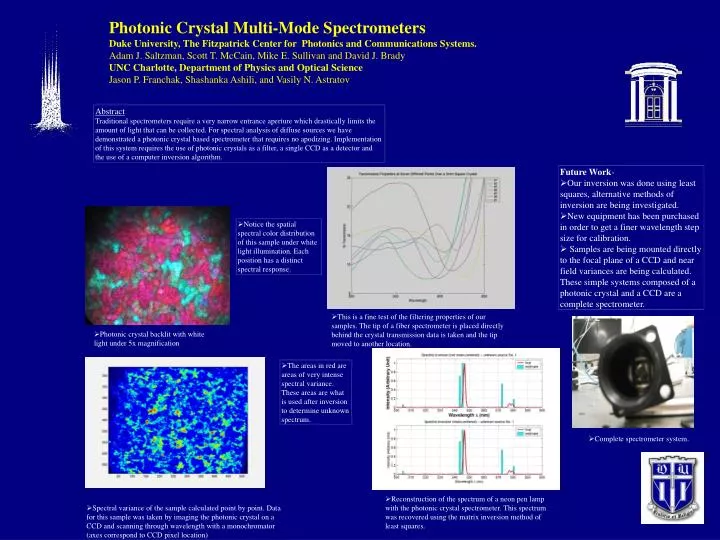
Photonic Crystal Multi-Mode Spectrometers Duke University, The Fitzpatrick Center for Photonics and Communications Systems. Adam J. Saltzman, Scott T. McCain, Mike E. Sullivan and David J. Brady UNC Charlotte, Department of Physics and Optical Science Jason P. Franchak, Shashanka Ashili, and Vasily N. Astratov Abstract Traditional spectrometers require a very narrow entrance aperture which drastically limits the amount of light that can be collected. For spectral analysis of diffuse sources we have demonstrated a photonic crystal based spectrometer that requires no apodizing. Implementation of this system requires the use of photonic crystals as a filter, a single CCD as a detector and the use of a computer inversion algorithm. • Future Work- • Our inversion was done using least squares, alternative methods of inversion are being investigated. • New equipment has been purchased in order to get a finer wavelength step size for calibration. • Samples are being mounted directly to the focal plane of a CCD and near field variances are being calculated. These simple systems composed of a photonic crystal and a CCD are a complete spectrometer. • Notice the spatial spectral color distribution of this sample under white light illumination. Each position has a distinct spectral response. • This is a fine test of the filtering properties of our samples. The tip of a fiber spectrometer is placed directly behind the crystal transmission data is taken and the tip moved to another location. • Photonic crystal backlit with white light under 5x magnification • The areas in red are areas of very intense spectral variance. These areas are what is used after inversion to determine unknown spectrum. • Complete spectrometer system. • Reconstruction of the spectrum of a neon pen lamp with the photonic crystal spectrometer. This spectrum was recovered using the matrix inversion method of least squares. • Spectral variance of the sample calculated point by point. Data for this sample was taken by imaging the photonic crystal on a CCD and scanning through wavelength with a monochromator (axes correspond to CCD pixel location)