Download
1 / 14
140 likes | 300 Views
Empirical Analysis of Purchasing Power Parity. BigMac Index vs Exchange Rate. 1. Purchasing Power Parity. Compare the price of BigMac in two diferent countries, denominated in two different currencies. ₩3,000 in Korea. $ 2.5 in US.

E N D
Empirical Analysis of Purchasing Power Parity BigMac Index vs Exchange Rate
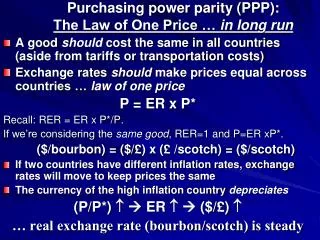
1. Purchasing Power Parity Compare the price of BigMac in two diferent countries, denominated in two different currencies ₩3,000 in Korea $ 2.5 in US • Exchange rates are determined to reflect purchasing power between two countries • In the hypothetical example, solve \3,000=$2.5 to get $1=\1,200, which is the won-dollar exchange rate as determined by the BigMac index
2. Purchasing Power and Exchange Rates • To compare purchasing power across countries, choose a homogenous product, like BigMac or Coca Cola, and compare prices denominated in local currencies. • Hypothesis to be tested: Exchange rates are determined by the BigMac index (or Coca Cola Index).
3. Big Mac Index • For each country, its BigMac index is the price, denominated in local curency, of “$1 value of BigMac.” • The Economist compiles the BigMac index since 1986 • Compare BigMac index with the actual exchange rates
4. Data • Download the data on the BigMac Indices and the exchange rates from The Economist Website http://www.economist.com Note: Click on BigMac Index located on the left-middle of the HomePage. Then, you can obtain BigMac indices little bit outdated. If you are really serious about this kind of research, you can subscribe to the current ones.
5. Model I • Simple Linear Regresion Test whether “ = 0 and = 1” (Exchange Rate) = + (BigMac) +
5. Results • Test of =0 (not rejected) • Test of =1 (rejected) (Exchange Rate) = - 57.31 + 1.81 (BigMac)
5. Interpretation • is significantly different from one Reject the Null • BigMac Index, reflecting purchasing power, is not equal to the exchange rate. Why doesn’t Purchasing Power Parity hold?
5. Look into data existence of outlier • In most countries, BigMac index and exchange rates take a value in the range of 0-1,000. In a few countries, these values are quite extreme. • Absolute PPP vs. relative PPP.
6. Model II –logarithmic tranasformation- • Regress ln(Exchange Rate) on constant and ln(BigMac index). Test whether =1. ln(Exchange Rate) = + ln(BigMac) +
6. Model II (log transformed) • Due to log-transformation, the impact of outliers is reduced. • In line with relative PPP rather than absolute PPP, beta now measures the percentage changes in the exchange rates associated with 1% increase in the BigMac index (concept of elasticity).
6. Results from Model II • Test of = 1 (cannot be rejected) ln(Exchange Rate) = 0.29 +1.01 ln(BigMac)
6. Interpretation • is not significantly different from 1. Cannot reject relative PPP • Conclude that 1% increase in the purchasing power (as measured by the BigMac index) is associated with the 1% increase in the exchange rate. • PPP holds in relative version, but not in absolute version.