Download
1 / 35
350 likes | 484 Views
Passive and Active Monitoring on a High-performance Network. Les Cottrell, Warren Matthews, Davide Salomoni, Connie Logg – SLAC www.slac.stanford.edu/grp/scs/net/talk/pam-apr01/ Presented at PAM-2001, Amsterdam April 23-24, 2001

E N D
Passive and Active Monitoring on a High-performance Network Les Cottrell, Warren Matthews, Davide Salomoni, Connie Logg – SLAC www.slac.stanford.edu/grp/scs/net/talk/pam-apr01/ Presented at PAM-2001, Amsterdam April 23-24, 2001 Partially funded by DOE/MICS Field Work Proposal on Internet End-to-end Performance Monitoring (IEPM), also supported by IUPAP
Outline • Results from active monitoring with PingER: • RTT, Loss, “jitter” • Passive border monitoring results • High perf throughput • achieving, measuring and impact • Simulation of high perf throughput
Active WAN Monitoring/PingER PingER • Measurements from • 32 monitors in 14 countries • Over 600 remote hosts in over 72 countries • Over 3300 monitor-remote site pairs • Measurements go back to Jan-95 • Reports on RTT, loss, reachability, IPDV, throughput, reordering, duplicates, looking at CLP (for bursty losses)… • Uses ubiquitous “ping” facility of TCP/IP • Countries monitored • Contain 78% of world population • 99% of online users of Internet
RTT from ESnet to Groups of Sites ITU G.114 300 ms RTT limit for voice 20%/year RTT ~ distance/(0.6*c) + hops * router delay Router delay = queuing + clocking in & out + processing
RTT Region to Region OK White 0-64ms Green 64-128ms Yellow 128-256ms NOT OK Pink 256-512ms Red > 512ms OK within regions, N. America OK with Europe, Japan
Loss seen from US to groups of Sites 50% improvement per year ETSI limit for loss (assumes random losses)
Loss to world from US Using year 2000, fraction of world’s population/country from www.nua.ie/surveys/how_many_online/
Losses within US for various Nets In general performance is good (i.e. <= 1%) ESnet holding steady Edu (vBNS/Abilene) & XIWT (70% .com) improving,
“Jitter” from N. America to W. Europe “Jitter” = IQR(ipdv), where ipdv(i) =RTT(i) – RTT(i-1) 214 pairs ETSI: DTR/TIPHON-05001 V1.2.5 (1998-09) good speech < 75ms jitter
“Jitter” between regions ETSI: DTR/TIPHON-05001 V1.2.5 (1998-09) 125ms=Med 225ms=Poor 75ms=Good
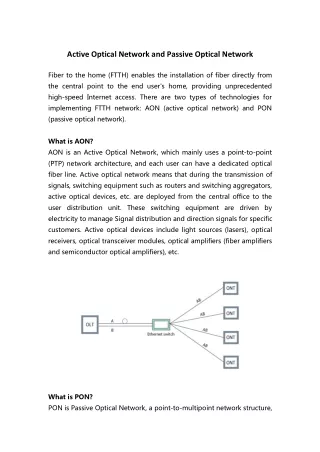
Passive site border monitoring • Use SNMP to get utilization etc. • Used to use OC3Mon with CoralReef for flows etc. but now have GigE interfaces • Use Cisco Netflow in Catalyst 6509 with MSFC, only on border at the moment • Gather about 200MBytes/day of flow data • Date recorded in binary every 10 minutes into RRD • The raw data records include source and destination addresses and ports, the protocol, packet, octet and flow counts, and start and end times of the flows • Much less detailed than OC3Mon, but good compromise • Top talkers history and daily (from & to), tlds, vlans, protocol and application utilization, flow times, time series, distributions • Use for network & security
Simplified SLAC DMZ Network, 2001 Dial up &ISDN 2.4Gbps OC48 link NTON (#) rtr-msfc-dmz 155Mbps OC3 link(*) Stanford Swh-dmz ESnet Internet2 slac-rt1.es.net OC12 link 622Mbps swh-root Etherchannel 4 gbps SLAC Internal Network 1Gbps Ethernet (*) Upgrade to OC12 has been requested (#) This link will be replaced with a OC48 POS card for the 6500 when available 100Mbps Ethernet 10Mbps Ethernet
SLAC Traffic profile SLAC offsite links: OC3 to ESnet, 1Gbps to Stanford U & thence OC12 to I2 OC48 to NTON Profile bulk-data xfer dominates HTTP Mbps in iperf 2 Days Last 6 months Mbps out SSH FTP bbftp
Top talkers by protocol Hostname 1 100 10000 Volume dominated by single Application - bbftp MBytes/day (log scale)
Not your normal Internet site 50-300Gbytes/day Ames IXP: approximately 60-65% was HTTP, about 13% was NNTP Uwisc: 34% HTTP, 24% FTP, 13% Napster
Time series UDP TCP Cat 4000 802.1q vs. ISL Incoming Outgoing
Flow sizes SNMP Real A/V AFS file server Confirms Nevil Brownlee’s data measured at SDSC: Heavy tailed, in ~ out, UDP flows shorter than TCP, packet~bytes 75% TCP-in < 5kBytes, 75% TCP-out < 1.5kBytes (<10pkts) UDP 80% < 600Bytes (75% < 3 pkts), ~10 * more TCP than UDP Top UDP = AFS (>55%), Real(~25%), SNMP(~1.4%)
Power law fit parameters by time Just 2 parameters provide a reasonable description of the flow size distributions
App: High Speed Bulk Throughput • Driven by: • Data intensive science, e.g. data grids • HENP data rates, e.g. BaBar 300TB/year, collection doubling yearly, i.e. PBytes in couple of years • Data rate from experiment ~ 20MBytes/s ~ 200GBytes/d • Multiple regional computer centers (e.g. Lyon-FR, RAL-UK, INFN-IT, LBNL-CA, LLNL-CA, Caltech-CA) need copies of data • Boeing 747 high throughput, BUT poor latency (~ 2 weeks) & very people intensive • So need high-speed networks and ability to utilize • High speed today = few hundred GBytes/day Data vol Moore’s law
Measuring TCP throughput • Selected about a dozen major collaborator sites in CA, CO, IL, FR, UK over last 9 months • Of interest to SLAC • Can get logon accounts • Use iperf • Choose window size and # parallel streams • Run for 10 seconds together with ping (loaded) • Stop iperf, run ping (unloaded) for 10 seconds • Change window or number of streams & repeat • Record streams, window, throughput (Mbits/s), loaded & unloaded ping responses
SLAC to CERN thruput vs windows & streams Hi-perf = big windows & multiple streams Improves ~ linearly with streams for small windows Default window size 1MB 100kB 64kB 16kB 32kB 8kB
Progress towards goal:100 Mbytes/s Site-to-Site • Focus on SLAC – Caltech over NTON; • Using NTON wavelength division fibers up & down W. Coast US; • Replaced Exemplar with 8*OC3 & Suns with Pentium IIIs & OC12 (622Mbps) • SLAC Cisco 12000 with OC48 (2.4Gbps) and 2 ×OC12; • Caltech Juniper M160 & OC48 • ~500 Mbits/s single stream achieved recently over OC12.
SC2000 WAN Challenge • SC2000, Dallas to SLAC RTT ~ 48msec • SLAC/FNAL booth: Dell PowerEdge PIII 2 * 550MHz with 64bit PCI + Dell 850MHz both running Linux, each with GigE, connected to Cat 6009 with 2GigE bonded to Extreme SC2000 floor switch • NTON: OC48 to GSR to Cat 5500 Gig E to Sun E4500 4*460MHz and Sun E4500 6*336MHz • Internet 2: 300 Mbits/s • NTON 960Mbits/s Dallas to SLAC mem-to-mem • Details: • www-iepm.slac.stanford.edu/monitoring/bulk/sc2k.html
Impact of cross-traffic on Iperf between SLAC & W. Europe All TCP traffic iperf HTTP bbftp SCP From SLAC To SLAC Iperf port traffic
Impact on Others • Make ping measurements with & without iperf loading • Loss loaded(unloaded) • RTT dRTT in msec.
Improvements for major International BaBar sites Links are being improved: ESnet, PHYnet, GARR, Janet, TEN-155 Improvements to come: IN2P3 => 155Mbps RAL => 622Mbps Throughput improvements of 2 to 16 times in a year
Iperf throughput conclusions 1/2 • Can saturate bottleneck links • For a given iperf measurement, streams share throughput equally. • For small window sizes throughput increases linearly with number of streams • Predicted optimum window sizes can be large (> Mbyte) • Need > 1 stream to get optimum performance • Can get close to max thruput with small (<=32Mbyte) with sufficient (5-10) streams • Improvements of 5 to 60 in thruput by using multiple streams & larger windows • Loss not sensitive to throughput
Iperf thruput conclusions 2/2 Site Window Streams Throughput CERN 256kB 2 9.45Mbits/ CERN 64kB 8 26.8Mbits/s Caltech 256kB 2 1.7Mbits/s Caltech 64kB 8 4.6Mbits/s • For fixed streams*window product, streams are more effective than window size: • There is an optimum number of streams above which performance flattens out • See www-iepm.slac.stanford.edu/monitoring/bulk/
Network Simulator (ns-2) • From UCB, simulates network • Choice of stack (Reno, Tahoe, Vegas, SACK…) • RTT, bandwidth, flows, windows, queue lengths … • Compare with measured results • Agrees well • Confirms observations (e.g. linear growth in throughput for small window sizes as increase number of flows)
Ns-2 thruput & loss predict 90% • Indicates on unloaded link can get 70% of available bandwidth without causing noticeable packet loss • Can get over 80-90% of available bandwidth • Can overdrive: no extra throughput BUT extra loss
Simulator benefits • No traffic on network (nb throughput can use 90%) • Can do what if experiments • No need to install iperf servers or have accounts • No need to configure host to allow large windows • BUT • Need to estimate simulator parameters, e.g. • RTT use ping or synack • Bandwidth, use pchar, pipechar etc., moderately accurate • AND its not the real thing • Need to validate vs. observed data • Need to simulate cross-traffic etc
WAN thruput conclusions • High FTP performance across WAN links is possible • Even with 20-30Mbps bottleneck can do > 100Gbytes/day • OS must support big windows selectable by application • Need multiple parallel streams • Loss is important in particular interval between losses • Compression looks promising, but needs cpu power • Can get close to max thruput with small (<=32Mbyte) with sufficient (5-10) streams • Improvements of 5 to 60 in thruput by using multiple streams & larger windows • Impacts others users, need Less than Best Effort QoS service
More Information • This talk: • www.slac.stanford.edu/grp/scs/net/talk/slac-wan-perf-apr01.htm • IEPM/PingER home site • www-iepm.slac.stanford.edu/ • Transfer tools: • http://hepwww.rl.ac.uk/Adye/talks/010402-ftp/html/sld015.htm • TCP Tuning: • www.ncne.nlanr.net/training/presentations/tcp-tutorial.ppt